Geoscience Australia has released DEA Land Cover 2.0, which incorporates the latest US Geological Survey Landsat data, including enhancements from Landsat 9.
The new version, available through the DEA Maps and the Digital Atlas of Australia, offers greater understanding of Australia’s diverse landscapes over a span of 35 years.
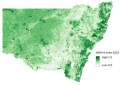
DEA Land Cover 2.0 provides a detailed classification of Australia’s land cover, using satellite data to map the physical characteristics of the Earth’s surface — from vegetation and built structures to bare ground and waterbodies.
The data is crucial for monitoring ecological changes, managing natural resources and understanding landscapes shift over time.
“DEA Land Cover 2.0 provides a comprehensive view of how landscapes evolve over time,” said Dr Cedric Jorand, Manager of Terrestrial Environments in Geoscience Australia.
“We can see every patch of land across the entire continent, tracking changes year by year since 1988.”
The latest version of DEA Land Cover introduces several new features and improvements:
- It characterises any 30 square metres of Australia, providing detailed insights into vegetation, soil, water, land, crop and grazing management;
- It offers data for any area of Australia from 1988 to present day;
- It enables agencies, land managers, and scientists to analyse land conditions over large areas and long timeframes;
- Enhanced cloud masking reduces noise and improves data quality; and
- The inclusion of Landsat 9 data provides better performance with more observations.
“If we take Quinn’s Rock in Western Australia as an example, DEA Land Cover data shows how this suburb has grown between 2000 and 2020,” said Dr Jorand.
“The data reveals the clearing of surrounding vegetation, initially classified as green pixels, transforming into bare surfaces shown in sandy colours. Eventually, these areas were developed into urban surfaces, which are depicted as pink pixels.
“By classifying every 30 x 30m patch of land across the country annually since 1988 to the present, DEA Land Cover 2.0 offers insights into trends in land use.
“This data is crucial for understanding how urban areas expand, how natural landscapes are altered, or how our water bodies have evolved through historic natural events such as the Millennial Drought, the 2019-2020 bushfires or the 2020-2021 La Niña event”.
DEA Land Cover is already being utilised by various government entities and businesses, including the Commonwealth Department of Environment, Climate Change, Energy and Water, and the Australian Bureau of Statistics.
As part of the 2.0 release, DEA Land Cover data will be the second set of Australia’s Earth observation data to join DEA Coastlines into the Digital Atlas of Australia.
DEA Land Cover users will continue to have access through DEA Maps, an interactive interface that enables users to view and analyse the DEA Land Cover data and visualise and explore a wide range of other geospatial data. It also provides access to other DEA products.