The Australian Bureau of Statistics (ABS) has released Great Barrier Reef Ecosystem Accounts experimental estimates.
The data provides estimates of the extent, condition and services provided by the different ecosystems within the Great Barrier Reef’s terrestrial, coastal and marine domains.
Covering a reference period of the 2022-23 financial year, the data replaces the experimental data previously released in 2017 and indicates the progress made in the National Ecosystem Accounts.
Although the ABS points out that the new statistics are themselves still experimental in nature, they do nonetheless show what can be done with current data sources and methods.
The ABS says it consulted widely to “identify the best suite of metrics and data sources available,” and that it expects to further refine the process for future releases.
What the Great Barrier Reef Ecosystem Accounts reveal
The ABS is a big user and creator of spatial data, so it’s no surprise that it can cast its net quite wide when assessing an area as large and active as the Great Barrier Reef.
Here are just two of the results to come from the latest Accounts:
- In 2021–22, photic coral reefs accounted for 4.70 million hectares (or 13.3%) of the Great Barrier Reef’s marine area while seagrass meadows covered 521,863 hectares (1.5%).
- In 2021–22, blue carbon ecosystems (mangroves, saltmarsh and seagrass meadows) stored 196 million tonnes or $337 million worth of carbon, with 2.56 million tonnes of carbon dioxide equivalent sequestered over the year.
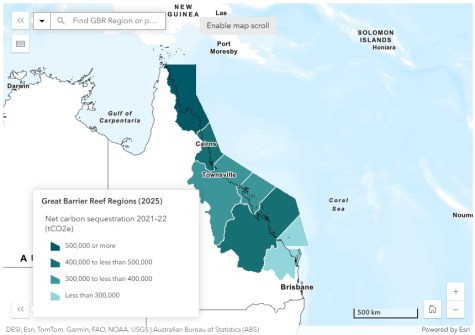
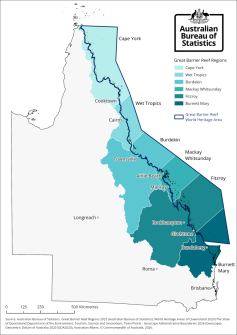
The area covered by the ABS Account is shown on the map below, and encompasses both maritime areas and hinterland areas that feed into the Great Barrier Reef.
With regard to the carbon sequestration statistics mentioned above, the image at the top of the page provides a graphical overview of the amounts stored in the various kinds of vegetation.
The ABS data reveal that millions of tonnes of carbon (MtC) were stored as follows:
- Mangroves retained 160.7 MtC (82.0%), valued at $276.8 million
- Seagrass meadows retained 28.0 MtC (14.3%), with a value of $48.2 million
- Saltmarsh retained 7.2 MtC (3.7%), with a value of $12.4 million
- Cape York retained the most carbon (53.5 MtC, 27.3%), followed by Fitzroy (43.7 MtC, 22.3%) and Wet Tropics (32.5 MtC, 16.6%).
More information about ABS accounts for Australia’s near-to-shore marine ecosystems, including the topic of carbon sequestration, can be found in our earlier article.
Related reading: