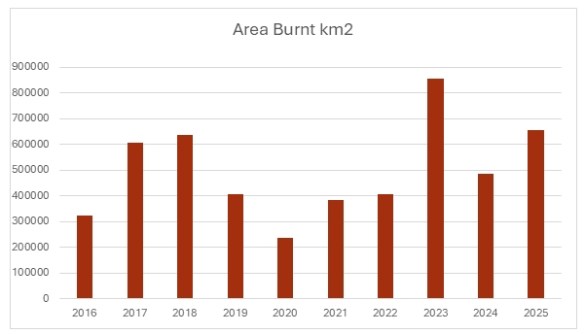
Last year was the second largest fire year over the past decade for Northern Australia.
That’s the conclusion published in the inaugural report from Australia’s most comprehensive and detailed fire mapping database.
The Fire Year Summary Report for 2025, which details fire activity across 80% of Australia, was produced by the North Australia and Rangelands Fire Information (NAFI) service, based out of Charles Darwin University (CDU).
The report says the exceptional 2025 fire season was driven by severe weather and storm-related ignitions.
The area covered by NAFI’s burnt area mapping captures around 97% of national fire areas.
Four-week fire
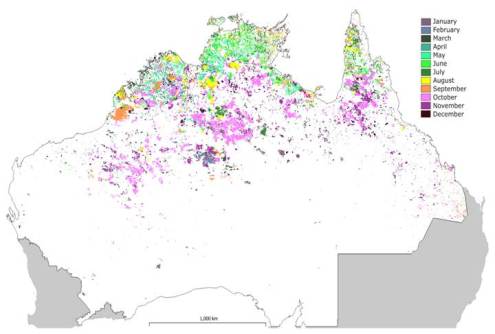
The report found that fire activity in 2025 followed expected seasonal and regional patterns, but severe late dry season conditions amplified fires in October.
The Northern Territory had the most fire activity, experiencing 29.6 million hectares burnt, followed by 19 million hectares in Western Australia and 14.3 million hectares in Queensland.
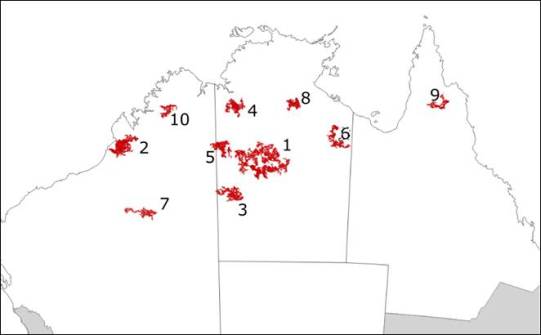
There were multiple ‘Terra-scale‘ fire events, or fires that burnt more than 1 million hectares.
The largest of these was in the Northern Territory’s Tanami Desert, where a 3.5-million-hectare fire burned for 28 days in October and November following ignitions from a dry lightning storm.
Fire management
CDU Northern Institute Senior Research Fellow Dr Rohan Fisher, who manages the mapping for the Northern Territory, said the data underscored October as being Australia’s fire season.
“Fire is a natural and important part of our landscapes. As is the management of these fires which Australians have been doing for many thousands of years,” Dr Fisher said.
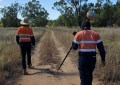
“First Nations rangers, pastoralists and other land managers are on the ground through the early part of the year preparing for the September-October season and they’re using NAFI data to do so.
“NAFI is one of the most accurate, regularly updated national scale data. Possibly the most accurate and robust fire dataset at this scale available for anywhere in the world.”
Record rainfall
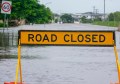
In the last quarter, the Northern Territory, particularly in the Top End, has experienced extensive and near unprecedented rainfall.
Bureau of Meteorology figures show that from January to March, the CSIRO Berrimah Station in Darwin recorded 1629 mm (the average is 1215 mm), the Alice Springs Airport station recorded 329 mm of rain (average is 120 mm), and Tennant Creek 470 mm (average is 300 mm).
This rain has increased the fuel load across much of Australia, according to Dr Fisher.
“The most fire-prone areas are the northern savannas, but they’re also the most intensely managed,” he said.
“Whilst these far northern landscapes experience the most fire over the last 15 years, we have seen an increase in proactive fire management led by Indigenous land managers.
“This has led to less fire overall and importantly less severe fires. The issue will be in the northern arid zones, with big rains leading to more heavy fuel loads across the deserts of Western Australia and the Northern Territory.”