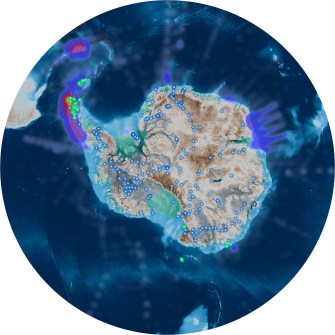
The new Seamap Antarctica portal offers a variety of geospatial and biological data about the frozen continent.
Launched by the Institute for Marine and Antarctic Studies (IMAS) and the Australian Centre for Excellence in Antarctic Studies (ACEAS) at the University of Tasmania, the new portal aims to make information about Antarctica more discoverable, accessible and useful for scientists, policymakers, educators and the wider community.
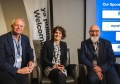
“Seamap Antarctica is a sophisticated Antarctic mapping portal and spatial data platform that is designed to support research, policy, conservation planning, education and communication,” said Co-founder, Professor Vanessa Lucieer, who is a marine spatial analysis expert and leads the Ecology and Biodiversity Centre at IMAS.
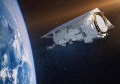
“Antarctic science is producing extraordinary volumes of information, with advances in mapping, imaging and observation revealing parts of the Antarctic seafloor and marine environment that were previously unknown.
“We have designed Seamap Antarctica to meet that challenge, bringing together huge volumes of information that would otherwise remain scattered across institutions, formats and disciplines. And that fragmentation has limited its collective value until now.”
Data discovery
Co-founder and IMAS data architect, Dr Emma Flukes, said one of the strengths of Seamap Antarctica is that it offers familiar mapping tools for spatial data users, while still being accessible to people who don’t use GIS every day.
The currently available layer categories are:
- Aerial views – satellite imagery, RADARSAT mosaics and scanned topographic maps
- Biology – such as ecosystems, behaviours, habit suitability
- Geology – various geomorphologies, seafloor sediment thickness
- Human dimension – historical data, human impact and human-derived threats
- Ice dynamics – glacial and sea ice, surface types and thickness
- Oceanography – both physical and biological
- Terrain – surveyed bathymetry, modelled terrain and topographic features
- Boundaries and POI – such as administrative and environmental management boundaries
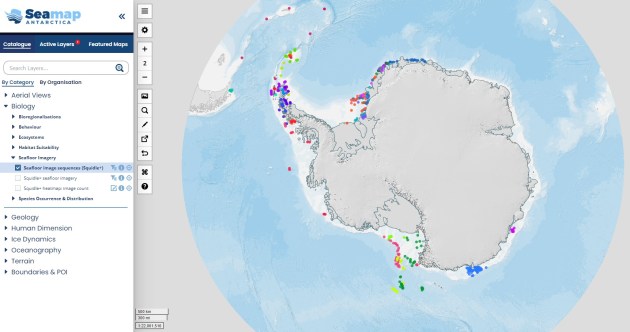
“Users can combine layers, reorder them, adjust opacity, switch between legends and filters, configure a map view for a specific purpose, and share it with colleagues and collaborators,” Dr Flukes said.
“A researcher might use it to frame a new question; a manager to assess what information exists in a region; a teacher to show students how environmental and biological information come together spatially; and a policymaker to understand what evidence is available and where the gaps remain.”
Interactive view
Professor Lucieer said that improving our collective understanding of the Antarctic marine environment means bringing the information together in ways that preserve its context, uncertainty and limitations, while supporting consistent interpretation across datasets, scales, and jurisdictions.
“At a time of accelerating environmental change and growing human pressures, we need better ways to bring Antarctic information together so it can be discovered, explored and used,” said Professor Lucieer.
“Seamap Antarctica provides that platform, and we are excited to make it publicly available as we continue to grow this incredibly vital interactive knowledge bank.”