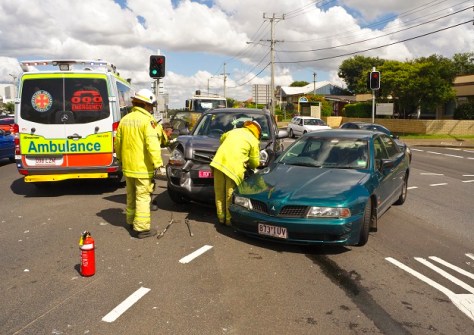
CrashDash was born out of frustration at having to deal with disparate state and territory road crash datasets.
By Anthony Aisenberg
Late one night, finishing road crash analysis reports for two Victorian councils, I had four browser tabs open across two screens. One held the New South Wales crash portal. The others were pulling state data for Ballarat and Bendigo in Victoria. Each portal had its own export format, its own field names, its own definition of severity. Hours passed reconciling data that should have been consistent.
That night made something obvious. If this is how long it takes someone who works in civic data every day, councils and transport professionals would be struggling even harder. That was the moment CrashDash stopped being an idea and became something that needed to be built.
The problem is structural
CrashDash is built on data from official police-reported road crash records. These cover collisions on public roads involving at least one moving vehicle — cars, trucks, motorcycles, cyclists, and pedestrians struck by vehicles. What counts as a reportable crash varies slightly by state, but generally includes any incident resulting in injury or property damage above a minimum threshold. E-scooter incidents are captured inconsistently across jurisdictions and are an emerging gap in the national picture.
Australia’s road crash data is publicly funded but practically inaccessible. Every state and territory publishes it differently. Some use static PDF summaries, others hide it behind search-driven portals built for specialists. Field names, severity classifications and data currency vary across every jurisdiction. There is no national view.
VIC: https://discover.data.vic.gov.au/dataset/victoria-road-crash-data
NSW: https://opendata.transport.nsw.gov.au/data/dataset/nsw-crash-data
QLD: https://www.data.qld.gov.au/dataset/crash-data-from-queensland-roads
WA: https://catalogue.data.wa.gov.au/dataset/?tags=crash
SA: https://data.sa.gov.au/data/dataset/road-crash-data
TAS: https://www.data.qld.gov.au/dataset/crash-data-from-queensland-roads
ACT: https://www.data.act.gov.au/Transport/ACT-Road-Crash-Data/6jn4-m8rx/about_data
For local government transport teams, consultants working across state boundaries and road safety advocates, this creates real cost. It is not just an inconvenience. It is hours of specialist effort to answer questions that should take minutes.
Building a unified picture
The core challenge was making fragmented datasets behave as one. Each state arrives in a different format, with different coordinate systems, different attribute schemas and different release cadences. Normalising them into a single consistent layer required building a pipeline that could handle those variations without losing fidelity to the source data.
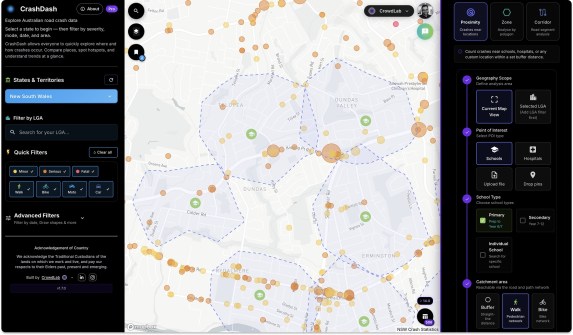
The result is a national road crash map that loads quickly, filters intuitively and gives professionals a spatial view they previously had to stitch together manually.
Guiding design principles
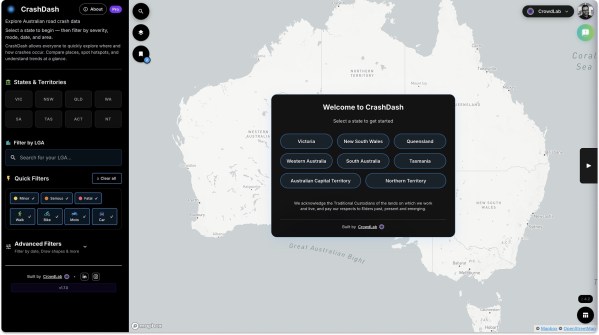
The first principle is the user experience. CrashDash had to be fast, reliable, and friendly enough that anyone could use it minutes after loading the page — after all, open data only fulfils its promise when people can actually work with it. If a council officer is standing in a meeting, they shouldn’t be waiting for maps to load or wrestling with obscure filters. So I obsess over performance, the user experience and plain-language filters.
The real proof came recently when providing a demo to a local council. Their use case, ‘walking and bike-riding crashes within 500 metres of a primary school, an hour either side of the bell’, was able to surface answers within a couple of minutes. That moment proved the product could unlock answers that once took days of specialist effort.
The second principle is coverage. The product had to offer a national lens. Anything less just rebuilds the silos we are trying to remove. Councils along state borders, consultants working across regions, and national advocates all need the same cohesive view. That is why each state and territory is on the roadmap, and why we keep pushing the ingestion pipeline to handle every dataset consistently.
The third principle is transparency. If I’m asking people to trust this tool, I have to show when each dataset was last updated, include definitions and provide additional context. We’re building state-by-state explainers, legal protections, and clear documentation that anyone can read.
Three spatial analysis tools
CrashDash Pro is built around three core tools that cover the main patterns councils and consultants need.
Proximity Analysis uses a point and radius to return all crashes within a defined catchment. Useful for school zones, intersections and point-of-interest queries.
Zone Analysis uses a drawn polygon to define an arbitrary area. Useful for suburb-level reviews, LGA boundary work or custom catchments that don’t follow administrative boundaries.
Corridor Analysis uses a drawn line and buffer to return crashes along a route or road segment. It is the most technically demanding of the three and the most useful for route-based safety assessments and before-and-after evaluations.
Who it’s for
CrashDash is primarily aimed at local government transport and road safety teams. But it is directly relevant to anyone doing spatial analysis in transport or road safety.
Consultants running before-and-after evaluations can use corridor analysis to pull crash histories along a defined route. Researchers building crash frequency models can filter by severity, road type, time period and crash type across a national dataset. Journalists and advocates can anchor their work in a shared, auditable source rather than inconsistent state extracts.
The platform is free to explore. The Pro tier, launching July 2026, will add the spatial analysis tools, organisation-wide access for councils, and full national coverage.
The core argument
When local governments can see a clear, current picture of their road crash landscape, they can deliver faster. Picture a transport engineer briefing councillors with a live map instead of a static PDF. Or imagine a school principal pulling up the morning crash pattern before meeting with parents.
Data-backed decisions become easier to justify. Road safety advocates can reference a shared source rather than relying on speculation. Communities gain a transparent view into what is happening near their schools, sports grounds, or bus corridors. Researchers can anchor their work in a national dataset rather than piecing together inconsistent fragments.
This is about turning raw data into action.
You can explore CrashDash at crashdash.crowdlab.com.au, or email the author at anthony@crowdlab.com.au.