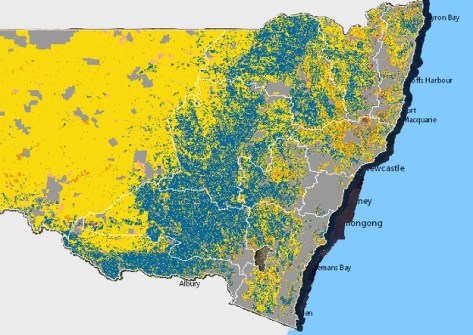
The map will come into force on 31 August 2026 following the end of the transitional period.
According to NSW Environment and Heritage, the Native Vegetation Regulatory (NVR) map will give landholders greater certainty about how native vegetation rules apply to their properties.
In addition, the Agency says the map should make clearer which approval pathways are available under the Land Management Code and Land Management Framework when it comes to making decisions about clearing native vegetation.
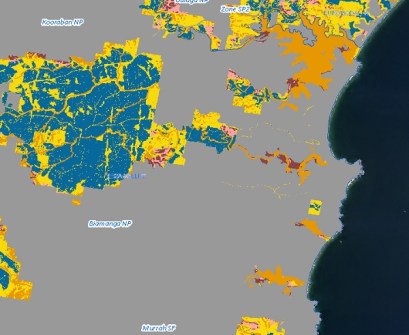
The map designates areas of land where the clearing of native vegetation is categorised as regulated or exempt under Part 5A of the Local Land Services Act 2013.
The NVR applies right across NSW with the exception of Bland Shire Council and Temora Shire Council areas, where current mapping arrangements will remain while the NSW Threatened Species Scientific Committee finishes an independent review.
According to NSW Environment and Heritage, “Native vegetation plays a critical role in supporting productive agriculture, protecting soils and water, and providing habitat for native wildlife. The NVR map helps balance these outcomes by showing where different management rules apply.”
What the Native Vegetation Regulatory map means for landowners
Prior to the Native Vegetation Regulatory map being published on 31 August:
- All decisions to clear native vegetation must comply with land categories defined by the Local Land Services Act in place since 2017.
- Landholders can access and review both the draft and transitional NVR Map online or via the Check My Land NSW app to view the land categories on their property and understand where native vegetation clearing rules might apply.
After 31 August, the following applies:
- Decisions to clear native vegetation must continue to comply with land categories defined by the Local Land Services Act in place since 2017.
- The NVR map designates where all these land categories occur. Self-assessments remain available for low-conservation-value grassland.
- The NVR map can be accessed online or via the Check My Land NSW app.
- Free category explanation reports and map reviews will remain available by contacting the Map Review Team based in Orange by calling 1800 001 490 or via email to map.review@environment.nsw.gov.au.
- Clearing approval pathways and self-assessment pathways remain available. Interested parties should contact Local Land Services for advice.
A 35-page NVR map user guide is available for download.
You can read more about the Native Vegetation Regulatory in our in-depth article.
Land clearing trends becoming clearer
In related news, the NSW Government has published the latest annual data on land clearing in NSW, showing a 16% annual increase in vegetation clearing across the state between 2023 and 2024.
The statistics are taken from the Statewide Landcover and Tree Study (SLATS), which is the NSW Government’s annual vegetation monitoring program and has now been running for 20 years.
This year’s data shows that most authorised clearing under the Local Land Services Act was for invasive native species management, accounting for 45% of authorisations.
Unallocated land clearing remains high; in 2024 it accounted for 60% of all clearing.
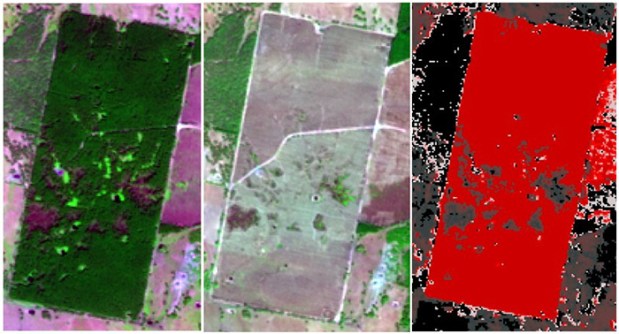
Clearing of native woody vegetation in 2024 was 19% below the 2018–24 average, but non-woody clearing was 13% above the 2018–24 average.
Woody vegetation includes mostly native trees, shrubs, woody vines, forests, woodlands and paddock trees.
Non-woody vegetation is a mixture of native and non-native species and includes understorey plants, groundcover plants, grasses and herbs.
The SLATS dashboard enables users to explore vegetation clearing trends over time across administrative boundaries, bioregions, land management categories and other data filters.