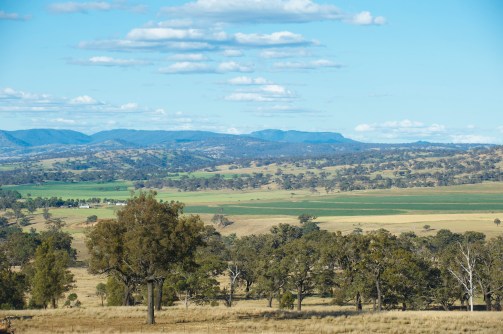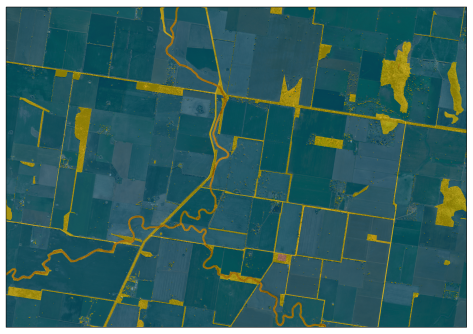
NSW’s Native Vegetation Regulatory Map has proven pivotal for mapping vegetation and identifying land use over 800,000 square kilometres.
Since 1788, the colony of New South Wales, covering what is now NSW and Queensland, began clearing vegetation for agriculture, development and forestry. One of the first regulations, in 1881, addressed the practice of ringbarking, and there have been nearly 30 laws enacted since then to manage aspects of vegetation clearing.
In recent years, technological advances and innovation have enabled the use of accurate maps to inform property-scale native vegetation clearing decisions across the 800,000 square kilometres that make up NSW. To be effective from a regulatory point of view, these maps need to show land types containing vegetation and classify them as regulated, vulnerable, sensitive, or exempt from regulation, while also considering past land use.
Surveying the land and building all of that information into one mapping product relies on a diverse range of technologies and expertise. Using existing mapping products and advanced innovation in remote sensing, the Remote Sensing and Analysis team at the NSW Department of Climate Change, Energy, the Environment and Water (hereafter, the Department, not to be confused with the Commonwealth agency of the same name) were up to the challenge.
The result is the Native Vegetation Regulatory (NVR) Map for NSW, a tool that helps landholders make decisions about managing their land.
Developing capability through partnerships
In 2008, the Remote Sensing team, comprising just three people at the time, was formally established in the Department. Its first objective was to establish the Statewide Land and Tree Survey (SLATS), based on the exceptional work of counterparts in Queensland’s Department of Environment, Science and Innovation. The SLATS programs have delivered tree-clearing data for NSW and Queensland back to 1988 and continue today.
Prior to the establishment of the Remote Sensing team, the Department had just completed the statewide land-use map as part of the broader national Australian Collaborative Land Use and Management Program, mapping agriculture, forestry, conservation and development work across NSW and monitoring for changes. Meanwhile, in 2007, the Joint Remote Sensing Research Program (JRSRP) was formed to advance remote sensing research through a partnership with the University of Queensland and the NSW and Queensland governments.
In 2014, an independent panel recommended that the NSW government create a map to clarify the requirements for land clearing permission based on vegetation and land use, to provide certainty for landholders concerning land management decisions.
This advice was accepted, and in 2015, the Remote Sensing team set out to deliver the new map.
Bringing together diverse spatial data
In order to meet customer needs for an accurate map that showed land use history, remnant native vegetation and environmental risks, the project needed to bring together diverse types of spatial data together in one product. The first iteration of the draft map would need to merge three important layers across all rural-zoned land: land use, woody vegetation and historical clearing data, which were products that had been developed within the Department over time for different needs.

Mapping land use formed the first base layer. Analysts used high-resolution aerial and satellite images to show where ground cover had been cleared for agricultural activities, such as cropping and sown pastures, or where land was used for perennial horticulture or plantation forestry, consistent with national standards.
The woody vegetation extent map layer tracked the location, extent and foliage cover of trees and shrubs at a 5 x 5 metre resolution, even identifying individual tree crowns. This map was updated to reflect changes in woody vegetation since 2011, based on available aerial and satellite imagery to 2017.
Using satellite image archives, the NSW SLATS program has mapped vegetation cover changes back to 1988, identifying clearing by comparing images of the same scenes taken about 12 months apart. Analysts assess if the loss of woody vegetation was due to agriculture, infrastructure, forestry, fire or natural processes, based on expert interpretation of patterns in the imagery, and ground truthing.
Taken together, the land use, woody vegetation and SLATS maps shows areas of vegetation cleared for agriculture, infrastructure or forestry, and areas that have not been cleared since 1990.
After 21 months, the foundations of the NVR Map were set in place — but developing the remaining layers was far more challenging.
Grasslands, the most challenging component
NSW is a vast mosaic of forest, woodland, grasslands and other ecosystems, and some are easier to understand from remote images than others. Legislative changes in NSW which commenced in 2017 include provisions for managing clearing of grasslands which had not been disturbed since 1990. Native grasslands are especially hard to discern from modified pastures and fallow paddocks using single satellite images alone.
The JRSRP helped provide a solution to this challenge, which was a pivotal technical breakthrough reminiscent of the move from still photography to motion pictures. The entire satellite image archive was used to identify how much change had apparently occurred in each of the 8.9 billion of 30-square-metre pixels which make up NSW. This index, called ‘fractional cover,’ shows the proportion of ‘green’, ‘non-green’ and ‘bare’ fractions in Landsat imagery, compiled into seasonal composites. Collectively, these datasets were used to generate a new derived dataset, the Seasonal Cover Disturbance Imagery and Index (SCDI). The assumption is that disturbed or modified areas generally have larger fluctuations in green cover and bare ground than undisturbed areas. The undisturbed areas generally change vegetation cover more slowly in response to grazing pressure and seasonal conditions and maintain a higher proportion of non-green cover. This is supported by research driven by the JRSRP.
The SCDI was calibrated from several thousand data points and the entire 29-year archive of Landsat imagery to 2017.

The team used the SCDI and clues to determine if grasslands were disturbed, looking for distinctive patterns across a paddock and comparing them against aerial photo mosaics from around 1990. The team had generated the mosaics from digitised aerial photos, using novel algorithms to piece them together and orthorectify them on the Department’s petabyte scale high performance computer (HPC).
Documenting the complex methodology
The Department’s deep collection of curated environmental and other datasets, along with imagery interpretation expertise and targeted ground truthing, may have been what finally brought the map into good shape at property scale. Beyond the three foundation layers, more than 140 datasets have been used to build the map. These datasets form the strong evidence that drives the indicative categorisation of land in relation to the criteria in the legislation. Most of these are related to identifying areas of high environmental risk, while others indicate exempt and excluded land.
The team curates these datasets and assembles them using ESRI ArcGIS and ArcPRO, running rigorous quality checks. These include comparing it against previous supplies to ensure consistency in attribution and expected changes between the two supplies. Keeping track of all this information has been a challenge in itself, and there’s no getting away from a good spreadsheet… or a few hundred of them. The team organises the vector data into a central, prescribed layer geodatabase using parameters set out in a master spreadsheet. This spreadsheet stores data sources, attribute queries, layer interactions and build order. This is then clipped into 344 individual 1:100,000 topographic map sheet files and loaded onto the HPC with a matching set of foundation data. Since the draft map was made publicly available in October 2022, the team re-runs this process each year to keep it current.
A series of complex Python scripts go to work, coiling and compressing input layers with native raster data for woody extent and vulnerable steep areas.
After another round of quality assurance checks on the tiles, the scripts stitch the tiles together to form a seamless statewide map, which is loaded onto a Geocortex web portal. Delivering this data in raster form is the best way to provide information to landholders via the Geocortex map portal because it refreshes quickly. It also avoids the complexities of statewide-scale geometries of combining more than 140 vector datasets and their associated interactions, not to mention adding few raster datasets into the mix. A final series of quality assurance checks and user acceptance testing are performed before an annual update is published.
To ensure transparency and best practice, the team has sought external advice all along the way, published the methods on the departmental website, and revised them as needed. In 2015 and 2017, independent experts from Geoscience Australia, the Australian Bureau of Agricultural and Resource Economics, and the Victorian and Queensland governments reviewed the map method and found the method was appropriate. The Department published its method most recently in 2022, which describes the science and analytical processes used to develop the native vegetation regulatory map.
Listening to customers and refining the map
While the technical processes of developing the map were key to producing strong initial maps that were often accurate at the property scale, the team persisted for several years to improve its accuracy, working closely with landholders who know their land like the back of their hands. In 2017, the Department ran a series of workshops around the map and its legislative purpose. Landholders were given a draft version of their map, to identify where they thought it might have been incorrect.
RMCG Consulting independently interviewed landholders from the 2017 consultation and found most were satisfied with the maps in relation to legislative settings.
In 2019, the Department and Local Land Services assessed map accuracy in the Snowy Monaro region, one of the most complex grassland areas in NSW. Landholders provided detailed management histories, including sowing activities and fertiliser records, for 668 paddocks covering 26,000 hectares. Comparing this data with the map and legislative settings showed over 90% accuracy.
In 2022, the Eltons Landholder Evaluation, which is also available on the departmental website, involved 96 landholders and 123 properties, representing just over 1% of NSW. Most landholders trusted the map, found it useful and valued the review process.

Working with landholders helped improve the map, and showcased what is now possible using technological innovation and grit. It also pioneered an ongoing map review function — a map review team. A team of regionally based staff continue to provide customer services to landholders who want to have the mapping on their land reviewed, and the insights from this process are used to continually improve it. The map review process is a leading-edge approach to legislation and regulation, giving landholders a way to challenge the map if they think there’s been a mistake. They can submit extra land management details, which the mapping team uses to re-assess and fine-tune the map with more context.
Continual process improvement
The team, working with others in the Department, has developed a workflow which ensures continuous improvement. The result is a technically robust design that enables the map to be recompiled as new data comes to hand and the open approach to customer feedback. Land management decisions, such as biodiversity agreements or vegetation clearing, are reflected in map updates. The original datasets have now been split into over 175 inputs, accounting for the unique settings of each dataset and delivering a more accurate and effective map. The map is also refreshed annually.
The data for steep lands, which are often more prone to erosion and need additional protection, are a great example of process improvement. Originally, steep land (greater than 18 degrees slope) was based on 30m raster data from the Shuttle Radar Topographic mission, run by the United States Geological Survey. The team has now upgraded to a 5m digital elevation model (DEM) and incorporated this into the map. This new steep lands capability is based on data from the ELVIS Elevation and Depth data platform. ELVIS was established under the Intergovernmental Committee on Surveying and Mapping, providing centralised access to all available point cloud height data. The ELVIS data was processed into a 5m DEM by the Remote Sensing team, delivering the new steep lands product for NSW. This has dramatically reduced the rate of map review request for this attribute.
The Regulatory Mapping team would love to hear from readers about any other examples of map review or improvement programs they are aware of. Drop a line to NVRMap.Team@environment.nsw.gov.au.
This article was supplied by the NSW DCCEEW Remote Sensing and Landscape Science team. You can read more about the NSW Native Vegetation Regulatory map at https://www.environment.nsw.gov.au/topics/animals-and-plants/biodiversity/native-vegetation-regulatory-map.


