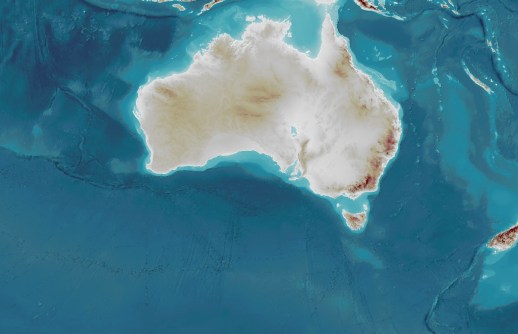
Geoscience Australia has released an updated version of the AusBathyTopo 250m (Australia) 2026 Grid.
The AusBathyTopo 250m (Australia) 2026 Grid is the most accurate representation yet of the Australian continent and the seabed its waters, incorporating numerous improvements since the last update in 2024.
Almost 100 extra seabed surveys have been included in the 2026 version, bringing greater clarity to areas that had previously only been modelled coarsely using satellite data or lower-resolution bathymetry.
The Grid will be of great use to those involved in environmental stewardship, marine planning, scientific research and offshore renewable energy.
Importantly, though, it does not provide the kind of detail required for maritime navigation; that kind of information is provided by other sources such as the charts prepared by the Australian Hydrographic Office.
To date, Australia has mapped 38.8% of its maritime jurisdiction at a resolution that’s suitable for ocean management, with Geoscience Australia continuing to work with external partners to expand that coverage.
The AusBathyTopo 250m (Australia) 2026 Grid and future updates are expected to contribute to the nation’s future success, including through the federal government’s major Resourcing Australia’s Prosperity initiative.
To find out more about the Grid, how it is produced and to what purposes it can be put, we spoke with Pip Bricher, the Director of National Seabed Mapping at Geoscience Australia.
How much of AusBathyTopo has been updated?
There are 1,542 data sets in there now, of which 84 are new or updated. Some of it is legacy data that we’ve been pulling out of our archives and cleaning up and getting ready for inclusion, to really unlock the value of the legacy.
The AusBathyTopo grid is 250 metres. Are there other grids at different scales?
This is our big national one. It covers an area about 8,000 kilometres wide and about 5,200 kilometres north to south — right out to the Cocos (Keeling) Islands in the north-west and right down to the south and east of Macquarie Island. It touches on various neighbouring countries’ waters as well, so we have a shared understanding of the shape of the seabed for the whole area.
And then within that we work on higher-resolution, 30-metre grids at the regional scale. We have a number of those already that have been built over the years, but under Resourcing Australia’s Prosperity, we’re now looking at making that an Australia-wide geoscience data set. So we’re trying to fill in all of the gaps and that supports regional planning of how we use these oceans.
And so at the national scale, you can pick out the really big features, big geotechnical hazards that you might want to be aware of. And then at the 30-metre resolution you can start working at the regional scale to start making really good planning decisions.
How and by whom has the data been gathered?
It’s an amazing effort by the entirety of the Australian seabed mapping community. Australia’s seabed is something like 4% of the Earth’s surface, and unlike mapping terrain, mapping the seabed’s really expensive. You’re typically looking at going out on a ship and running backwards and forwards in systematic survey lines — they call it ‘mowing the lawn’ — mapping small patches at a time. And obviously this is expensive, it’s logistically challenging, you need specialised equipment, you need specialised skills.
Australia has quite a wide range of organisations that do that for different purposes. We have the Australian Hydrographic Office which looks after navigational safety. We have various federal and state agencies that are interested in managing the seabed for lots of different reasons. We have researchers, we have private industry. And we have companies that are willing, just when they are going on a transit, to collect data as they go.
Geoscience Australia leads the collaborative AusSeabed initiative, and that’s where we bring the community together to work on sharing data through the AusSeabed Marine Data Portal. And that includes setting standards so that everybody’s collecting data to a really high quality to make it much more easily re-used for lots of purposes.
Aside from the 38.8% coverage, presumably the rest has been mapped to some degree, even if it’s only from GRACE gravity data?
Exactly that. We’re using the gravimetric, satellite-based data to get a very, very coarse modelled surface and then where we’ve got direct observational data — whether that’s coming from multi-beam or single-beam bathymetric surveys, it might be LiDAR or satellite-derived bathymetry in the very shallow waters — we put that on top.
The space-based data tells us roughly what’s there, but it’s really not giving us a strong sense of the shape of the sea floor and how to best manage it. There’s real information in it, but it’s pretty coarse.
What about the international Seabed 2030 project. Does Australian data feed into that?
Absolutely. So Geoscience Australia signed an MOU with the Nippon Foundation GEBCO Seabed 2030 project in 2024 to co-operate on sharing seabed data. So, and these AusBathyTopo grids are how we are doing that. So we compile the best possible surface we can in the Australian region. And then now that this one’s finished, we’ll be sending that through to GEBCO for inclusion in next year’s global grid.
In that way we’re supporting the GEBCO initiative in that they don’t need to do the detailed work in our waters because we’ve done it for them, and we get the best possible resolution and the best possible impact that we can. Because sometimes we have access to data that isn’t going to be available to them directly, but we can include it.
You just mentioned the word surface there. What type of model is the AusBathyTopo grid?
It’s basically a digital elevation model and it’s seamless at the coast. So we go right from the top of Mount Kosciuszko (elevation 2,228 m) down to the deepest parts of our waters, the Hjort Trench (depth ~6,500 m) south of Macquarie Islands. We put a lot of work into making sure that we get a seamless coastal transition; so if you’re trying to understand coastal impacts and how water movement impact works at the coastal region, we’ve got a beautiful integrated model now.
Who uses this data? Fisheries, those who study ocean currents for climate purposes and so on?
For all of those purposes, for managing offshore infrastructure and for a whole wide range of reasons, you need to know what the shape of the sea floor is. Are there cliffs or are there nice flat bottoms? What sort of structure is it made of? You can start to get some hints of that out of the bathymetry. If you’re looking for habitats for all kinds of species, including commercial fish, the shape of the seafloor is going to drive a whole lot of the information you need about the environment.
The shape of the seafloor influences where water flows. So if you’re looking for regional ocean current modelling, seabed maps will inform that. Or if you’re looking for something like tsunami modelling or coastal hazards, the shape of the seafloor is going to inform all of those as well.
Are there any other points you’d like to make?
Please come and talk to us at AusSeabed if you’re sitting on data that can help us. We have 61.2% of our maritime jurisdiction that we don’t currently know we have bathymetry data for. I suspect some of your audience do know where some of that is and we’d love to hear from them.
Related reading:
Seabed mapping along Australia’s eastern coast
UWA Oceans Institute becomes a Seabed 2030 partner