Can we measure the greenery residents actually see from an apartment? The answer requires a 3D, observer-centred approach called AGVM.
By Shinjita Das
Existing greenness maps can show a city’s tree canopy in fine detail, but the presence or proximity of vegetation does not always mean a resident can actually see it.
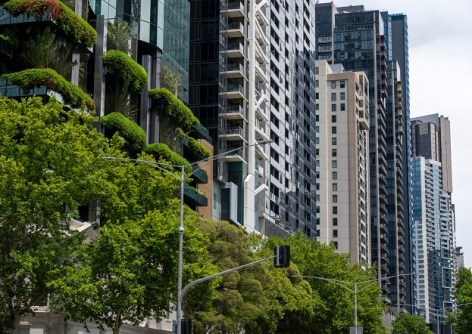
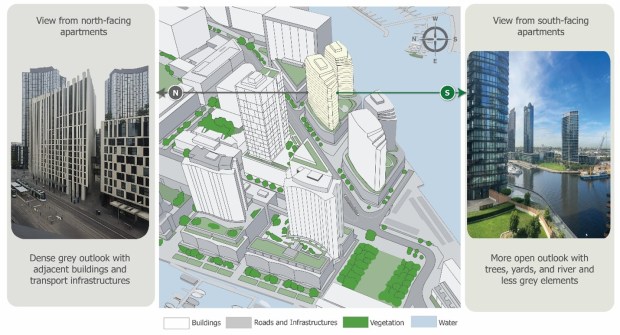
A park may sit only metres from a building and still disappear behind another tower. Within the same development, apartments facing one direction may look out onto adjacent buildings, roads and transport infrastructure, while those on the opposite side open onto the sky, water and distant vegetation. The address is the same, but the visual environments experienced by its residents can be entirely different.
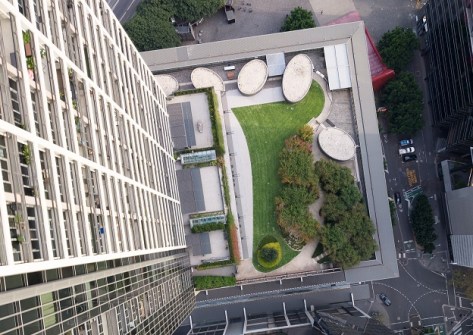
This issue is becoming more pronounced in high-density cities, not only because towers, narrow streets and varied building orientations can block urban greenery from view, but because greenery itself is distributed unevenly across a city to begin with. So as cities grow vertically, understanding what residents can see from home is becoming increasingly important.
Current challenges in modelling apartment views of urban greenery
Canopy cover, satellite-derived vegetation indices, and neighbourhood buffers can estimate the amount of urban greenery surrounding a building, but measurements from a top-down angle limit their ability to capture eye-level views.
A different approach, street-view imagery and computer vision, brings greenery assessment closer to the human perspective, but they still view the city from the road rather than from inside an apartment. A model may be able to identify a tree in an image, yet it does not necessarily recover the depth, floor height and architectural obstructions needed to reconstruct a resident’s actual line of sight.
LiDAR and building information models sit at the other end of that spectrum, offering far greater geometric detail, but at a cost. The data are expensive, computationally heavy and unevenly available from one building to the next, and processing millions of LiDAR points or detailed BIM components can add more complexity than a model needs.
The challenge is therefore to find a middle ground: data models detailed enough to represent the environment, floor level, orientation, and sightlines in three dimensions, yet scalable and cost-effective enough to apply across thousands of apartment viewpoints.
Translating this requirement into practice, my research developed the Apartment Greenery View Measure (AGVM), to quantify the view at the apartment level. It can be applied citywide without requiring LiDAR-grade or fully detailed building models, making it a computationally efficient way to measure what residents’ views look like.
Modelling apartment visibility with AGVM
AGVM is built around a spatial viewshed model, combining two key inputs: a three-dimensional representation of the surrounding environment, and precise viewing geometry of each observer.
The first input, the spatial environment, was reconstructed using segmented high-resolution environmental models (20 cm × 20 cm pixels) with heights obtained from the CSIRO Urban Monitor, enabling a realistic spatial representation of neighbourhoods, including vegetation, built infrastructure and water features.
Buildings within this environment were represented as simplified 3D models generated procedurally in CityEngine from building footprints, heights, and floor levels, without requiring fully detailed internal layouts or architectural details.
The second input, viewing geometry, geocodes each observer point as an approximate proxy for a resident’s position, placed at the midpoint height of each floor within the building models, the point closest to where a resident would actually stand to look outside. Each point carries horizontal coordinates (x and y), an elevation (z) corresponding to that floor’s height, and an aspect indicating the direction it faces.
From each point, the viewshed projects line-of-sight vectors through a defined horizontal and vertical field of view. As each vector moves across the surface, it is compared with the height of intervening terrain, buildings and canopy. When a rooftop, tree or other feature rises above the sightline, the view is blocked, and the area behind it is treated as obstructed — generating a binary visible/invisible surface map.
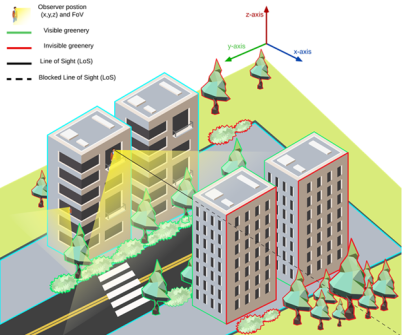
As not all visible features contribute equally to the view, AGVM weights visible cells by distance, giving nearby features greater influence than distant ones. The output is an apartment-level view profile comprising three separate percentages: the distance-weighted proportions of green, grey and water within the visible field of view.
This workflow supports aggregation at multiple spatial scales, from individual units to floors and buildings, providing a flexible framework for assessing equitable access to visible greenery across the city.
The full methodology and results are published open access in Computational Urban Science in Greenery from apartments: quantifying and comparing views with residents’ perceptions.
The pattern AGVM revealed in the views of urban greenery
Applied to 30 Melbourne apartment buildings from the High Life Study, the results showed that grey infrastructure dominated the average view, making up about 73% of what residents could see, compared with 23% greenery and under 5% water.
Height did not follow a single pattern. In some buildings, greenery fell away floor by floor as nearby trees dropped out of sight. In others, it increased with height, as distant vegetation came into view once neighbouring buildings no longer blocked it. Orientation added a further layer of variation. Even apartments facing the same direction within the same building could see different amounts of greenery, depending on what stood directly in front of each one.
Comparing the model against residents’ own estimates showed that the two measures were related but not identical. Most residents underestimated their own greenery views. The model can register a distant or partial tree that a resident doesn’t consciously notice, while a single prominent tree close to a window can dominate someone’s sense of their view even if it barely registers as a measurable percentage.
Future applications of AGVM
Planning for urban greenery should consider not only its access and proximity, but its visibility from home.
While conventional greenness maps remain essential for showing where vegetation is distributed, AGVM adds a more granular, dwelling-level perspective by revealing how much urban greenery each apartment can see, who can benefit from it and how building height, orientation and surrounding obstructions shape that view.
Integrated into urban digital twins, the measure could support ‘what-if’ testing. Planners could examine how a proposed tower, the removal of a street tree or changes to a nearby park would alter apartment views, then compare alternative design or greening strategies before changes are made.
AGVM also has value for population-health research. Residents are often assigned the same neighbourhood- or building-level greenness exposure, even when their outlooks differ substantially. Measuring visibility from different apartment viewpoints allows for the assessment of view exposure and residents’ health and wellbeing to be assessed at the individual level.
The broader opportunity is not to replace existing greenness measures, but to complement them with evidence about how visible greenery is distributed, and who can access it visually, as cities continue to become denser.
Shinjita Das is a PhD candidate in the School of Global, Urban and Social Studies and the Department of Mathematical and Geospatial Sciences at RMIT, supervised by Dr Sarah Foster and Dr Chayn Sun. Her PhD is embedded in the ARC-funded High Life Study, researching apartment living, greenery, and mental health using 3D GIS modelling and spatial statistical analysis. As a member of the GISail research group, she has broader interests in urban heat vulnerability, spatial machine learning, and health-integrated environmental risk modelling. Passionate about sustainability, she is driven to generate evidence that supports healthier, more liveable urban environments.
Related reading:
The case for 3D cadastres and immersive technologies
AI-based spatial framework for vertical greenery