Image source: Jon Fairall
This article was written by Jon Fairall and first published in the June/July 2016 issue of Position magazine. It is the final installment in a two part exclusive feature article.
If you haven’t done so already please read Part-1 to learn how the search for MH370 unfolded and the clues that point to the ‘7th Arc’ in the Southern Indian Ocean.
Getting into deep trouble in the search for MH370
In principal, finding an object on the bottom of the sea is not difficult. Although visible light does not travel well through water, sound waves do. The business of reflecting sound waves off underwater objects, or sonar, is a well understood science. However, there are severe physical limits on the resolution one can obtain. A ship using a multi-beam sonar can see features on the deep sea bottom that are possibly 50 to 100 metres in width, too course to see aircraft parts. To see the aircraft’s wreckage with sonar, one needs to get the sonar transmitter to within a few hundred meters of it.
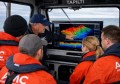
This is also less problematic than it sounds. The best modern technique is to mount the sonar either on an unmanned underwater vehicle, or on a tow fish. The former is just a robot submarine; the latter is towed behind a ship on a long cable.
To get stories like this delivered to your mailbox every week, subscribe to our weekly newsletter.The problem with both these methods is that, in order to get the underwater sonar to within a few hundred metres of the bottom, one needs to know where the bottom is. Prior to the crash, the best sea floor mapping in the region was Geoscience Australia’s series of maps of the ocean floor at 50 metre centres. However, this coverage only extends to 108 East (about 600 km from the coastline). The Australian Bathymetry and topography grid is a 2009 dataset with 250 metre centres that extends to 92 East. Both fall short of the search area.

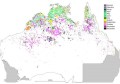
3D model of the seafloor terrain based on sparse pre-existing data, some of which has been derived from satellite gravity measurements and some from ocean passage soundings. Source: Geoscience Australia.
Very little was known about the sea floor in the MH370 search area itself. The best data of the sea floor morphology in the search area were derived from satellite gravity measurements and provided data that might have a resolution of 1,500 metres per pixel at best. What was known was that the dominant features in the search area was Broken Ridge, an extensive linear, mountainous sea floor structure that once formed the margin between two geological plates. Today, it is part of the geologically quiescent Australian plate, but between 20 and 100 million years ago, it looked much like a divergent plate margin such as the Mid-Atlantic Ridge.
This lack of information began to matter when the Royal Australian Navy deployed an unmanned underwater vehicle from its support vessel, Ocean Shield, in the immediate aftermath of the crash. Without maps, operators had to guess how far down to send the sub. Missions were aborted and on at least one occasion, the submarine went below its design depth.
A greater knowledge of deep ocean bathymetry is fundamental to understanding plate tectonic history.”
As a result, the search was divided into two phases: a bathymetric survey, followed by a high definition search. Bathymetric survey vessels—the Chinese survey ship Zhu Kezhen supported by the Malaysian ship Bunga Mas 6 and the Dutch vessel Fugro Equator which was contracted by Geoscience Australia—spent months at sea in late 2014 and early 2015, scanning the sea floor with multi-beam sonar to gather detailed, high-resolution data.
The ships collected data over 200,000 square kilometres. Their data was later processed into detailed maps and three dimensional fly-throughs at Geoscience Australia in Canberra. Subsequent mapping was generated with a definition of 40 to 110 metres per pixel, sufficient for the guidance of deep diving underwater vehicles.

3D view of volcano with added icon showing location of towfish. Source: ATSB.
Unintended findings
To the delight of oceanographers, the data has revealed many seabed features for the first time. They have found kilometre high sea mounts, parallel ridges that stand 300 metres above the sea floor and depressions 1,400 metres below their surroundings. In some places, the sea floor is 6 km deep.
The survey has also revealed regions of harder and softer sea floor composition, defining areas of sediment and rock. A spokesperson for Geoscience Australia says the region to the north of Broken Ridge consists of much older seafloor that is now covered with 300 metres of sediment. “Mass wasting features such as rock slides and debris flows are present throughout the region, but mainly along the northern flank of Broken Ridge and the Batavia and Guldren Draak seamounts.”
For scientists, a greater knowledge of deep ocean bathymetry is useful for many reasons. It’s obviously fundamental to understanding plate tectonic history. It’s also essential for the creation of hydrodynamic models that describe deep ocean currents and connectivity. The depth of oceans also play a major role in defining the habitat of marine flora and fauna. It is essential information for people who wish to locate areas where unique biological communities may exist.
On its website, Geoscience Australia says: “The data acquired as part of the bathymetric survey has been collected for the sole purpose of finding the missing plane and to bring closure to the families of those on-board. However, as it is some of the first high resolution data available in these areas, it is of great interest to the scientific community and will be released to the public in due course”.
 This article was written by Jon Fairall and was first published in the June/July 2016 issue of Position magazine.
Jon Fairall is the founding editor of Position magazine. He now operates as a freelance journalist and author.