Smoke from the 2019-2020 Australian bushfires, as seen by the International Space Station.
This article was originally published in issue 105 of Position magazine. It is authored by Martin Tomko, Lew Short, Sisi Zlatanova and Maurits van der Vlugt.
Frequent, devastating emergencies
As a consequence of the rapidly changing climate, devastating emergencies unfold more frequently, their consequences last longer and reach deeper. The Australian bushfire season 2019-2020 led to the largest non-war, domestic defense force deployment and evacuation in Australian history. The recurrent nature of emergencies stresses the traditional transitions from prevention and preparedness, through response to recovery. In this article, we discuss the experience of affected users when trying to access and interpret the spatial information about the disasters, and the how we, as spatial professionals, should re-think spatial communication for situational awareness.
Emergency communication landscape
While Australian bushfires are still burning and directly or indirectly putting the environment, properties, and health at risk, the north and east of the country floods, Melbourne is covered in giant-sized hail, and a novel coronavirus spreads. Such rapid serial co-occurrence of hazards putting different populations at risk strains traditional emergency management and communication. Past inter-agency emergency management reviews have targeted data integration and response coordination, with geospatial professions and technologies acknowledged as key. This led to improvements in Australian emergency management at state levels. For instance, Victorian emergency communications coordination has consolidated by the establishment of the coordination body ESTA (ESTA Act 2004) and subsequent operational refinements following the Black Saturday bushfires in 2009. Bodies such as EMSINA further facilitate coordination between states. Yet, while this integration facilitates the work of emergency professionals, it is not always evident to the affected communities. In this article, we discuss the experience of affected users when trying to access and interpret the spatial information about the disasters, and the how we, as spatial professionals, should re-think spatial communication for situational awareness.
Spatial information for situational awareness
The communication of the spatial extent of emergencies and their expected spread is a critical piece of situational awareness. Affected people need accurate, up-to-date information on which to base their emergency response, and their families and friends need the ability to assess their situation. This year, the emergency communication about the Australian bushfires has triggered major criticism, particularly due to frustrations with the spatial information being shared.
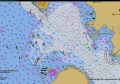
Let’s consider a sample of early notes we have collected during this year’s crisis, centered around a number of recurrent themes illustrated by Figure 1: content, presentation, and user interface. Together, these form the cornerstones of user experience (Ux). Our data collection still continues.
(1) Finding reliable sources of information: While direct emergency communication has integrated well, the end-user channels are unclear and hard to find. Each state has their own emergency warnings site. Their names and Web addresses are not standardised, the systems are not integrated, or even provide mutual links to each other. Tourists or people that do not live in hazard-prone areas may not be aware of these channels and how to navigate between them. In a country still poorly covered by mobile internet access in rural areas, the reliance on low-bandwidth mobile signal and google search burdens emergency decision-making. Predictable information source findability is key for decision making.
(2) Non-standardised content: the spatial content presented by the above services is unhomogenous in content, and therefore hard to integrate technically and cognitively. For example, the extent and status of the same fire at the border of two states may be labeled and their extent generalised differently. Descriptions of warning levels follow different conventions between state agencies. Note the sparser information about bushfires across the Victoria/NSW border in Figure 1, or the complete lack of any spatial information across the SA/Vic border on the SA emergency site. This was experienced as a significant hurdle by tourists evacuating from Mallacoota (Vic) this summer, lacking understanding of the situation across the near NSW border.
Users are further confused by inconsistent background maps, providing context for decision-making. Victoria uses Vicmap data (although not credited on the mobile version of the website), NSW uses Google maps data (again, not credited on the 02/01/2020 version of the website, but since added), while SA only states “Government for South Australia”. These emergency apps are used to support decision making by affected users, who may need to plan evacuation routes. Unfamiliar map keys, and inconsistent, possibly outdated background data add to their confusion, e.g., when locating dirt tracks.

Figure 1: Mobile phone website screenshots (Android) of the fire situation as shown at the border of Victoria and NSW, at the same time (02/01/2020 at 7.25pm). Middle: NSW Fires Near Me; Right: Emergency Victoria Incidents and Warnings. Right: for completeness, a screenshot of the SA emergency warnings site from 31/01/2020.
(3) Non-standardised content presentation and user interfaces: the noted inconsistent status levels and fire extents are further exacerbated by the use of inconsistent symbology and colour codes of warnings across agencies, imposing cognitive barriers to emergency information interpretation. In addition, Victoria and NSW delineate burned and currently affected areas differently. EMSINA has been promoting a consistent set of symbols for years, yet the adoption across state agencies has thus far not eventuated.
As geospatial professionals, we also know that there is no space without time: Victoria notes the timestamp of the presented information explicitly, while the NSW app only notes how long it has been since last user interface update. Function naming varies widely (“Locate me” vs “Use my location”), and so does map functionality (Filter vs Layers). The user experience appears informed by developers of (professional) geoportals, rather than informed by end-user needs.
Subscribe to Position magazine to stay on top of the latest industry news and analysis.
Distributed channels for emergency information dissemination
The rapidly changing public communication landscape affects emergency communication, a distinctive feature of all emergencies in recent years. Authorities no longer have full control over channels and information used by people to gain situational awareness. The community expects the ability to maintain situational awareness through fast, accurate, updated, and tailored information provided through their habitual information channels, not purpose-made emergency information apps. Communities also rely on self-help, for instance to fill-in information lacking from authorities. Social media now facilitate a substantial part of emergency communication (see Hughes and Palen, 2009, Vieweg et al., 2010 and consecutive publications from the project EPIC, http://epic.cs.colorado.edu/), addressing the traditional top-down communication from agencies. Centralised channels are rigid, and cannot accommodate all expectations from the community, by design. A large amount of highly helpful information is spread through informal channels such as Twitter and Facebook (Figure 2).

Figure 2: Examples of self-help by Facebook groups (Mallacoota Community Page). Conditions and restrictions change fast, and self-help groups with members on the ground are an important source of trusted information.
We acknowledge the efforts by the agencies, increasingly catering to populations using social media feeds (Figure 3). Consider the examples below: ForestFireManagement and VicEmergency spread a consistent message, at the same time, with a consistent hashtag. This is an important part of good practice – users start following a set of hashtags that establish themselves in a specific emergency, and need the assurance that they will not miss on vital information. Yet, are social media communications as well coordinated as the internal agency response? While in the case of Victorian bushfires emergency agencies fed the immediate warnings well, additional information required for decision making was lacking. Vicroads, intuitively the main source of information on traffic, did not tweet since October.
Social media monitoring and information management is arguable the next frontier for spatio-temporal emergency information. Moderating of out-dated, misleading or even deliberately false information through fact-checking becomes a mandatory activity during emergencies. (https://factcheck.afp.com/these-maps-do-not-show-individual-bushfires-australia-january-2020). The monitoring of relevant communication channels is another: for instance, domestic Chinese-speaking users and tourists are more likely to use WeChat than Twitter.

Figure 3: Two Victorian agencies issuing the same Tweet alert, at the same time, with a consistent message and hashtags (31/01/2020). A separate entity (IncidentAlert) feeds a message with additional place names, and missing hashtag. Yet, a Victorian user would not find information about evacuation roads – Vicroads does not tweet (last tweet found on 31/01/2020 shown). Users of WeChat discuss Australian bushfires in Chinese, with distinct hashtags.
Aggregators and dashboards
Users’ frustration leads to the emergence of mash-ups and aggregators, integrating and supplementing information from authorities and the public with additional decision-support information, such as wind direction. A dominant software platform became Ushahidi, following the earthquake in Haiti and since deployed in emergencies worldwide. Bushfireconnect.org (now defunct), addressing the aftermath of Black Saturday 2009, was an early and prominent implementation in Australia. While technical standardisation of data feeds improved, mash-ups still directly suffer from the content and presentation inconsistencies (see https://bushfire.io/).
The single-disaster focus on many aggregator deployments leads to disappearance of an information channel after the transition from the response to the recovery phase, affecting findability. A new, equivalent site is often deployed at the next disaster, re-living the product lifecycle and impacting on the user experience. The retirement of systems is a particular pain point (see Figure 4).

Left: Metadata notification about retirement of an ESRI ArcGIS Online page with Australian Bushfire information. Right: a non-responsive website layout for the EMSINA dashboard impedes user experience on mobile, the primary access channel to emergency information.
Lessons for the future
Social media and alternative information channels have been an increasing force of our information landscape for over a decade. It is no longer a question of fighting and perceiving such channels with suspicion – they have provided real value during the ongoing bushfire crisis. Emergency response authorities and spatial professionals need to take a user experience (UX) approach to the re-thinking and re-design of emergency information communication, working together with the affected communities to understand what information is needed at all stages of the emergency cycle. They need to research and implement means to present emergency information unambiguously and consistently across information channels, and be ready to use the power of self-organised communities pro-actively during future emergencies. There is no doubt these will be here sooner than we wish for.
Subscribe to Position magazine to stay on top of the latest industry news and analysis.