This article was contributed by Dr. Trevor Dhu of Geoscience Australia, and was originally published in issue 97 of Position magazine.
Digital Earth Australia (DEA), an analysis platform that uses satellite data to detect physical changes across Australia in unprecedented detail, has recently introduced new features to ensure its high quality data products are now even more accessible for individuals, industry and government.
By combining historical data from the last 30 years with an ever growing range of information from new satellites, DEA provides regular updates for the entire country via its NationalMap product. It can be used to identify soil and coastal erosion, crop growth, water quality and changes to cities and regions in greater detail and with more authority than previously thought possible.
This wealth of knowledge is invaluable for decision-making, from the government level right down to a single farmer looking for ways to innovate and expand their business.
Four new data products from DEA have now been released on NationalMap, a free access website for map-based access to spatial data from Australian government agencies. These products include Sentinel 2 data processed in near-real time, Mangrove Canopy Cover, the Surface Reflectance Geometric Median, and Water Observations from Space.
Stay up to date by getting stories like this delivered to your mailbox.
Sign up to receive our free weekly Spatial Source newsletter.
DEA’s Program Director, Trent Kershaw, said the new releases deliver on government priorities, such as measuring agricultural productivity, managing coastlines, monitoring water quality and better targeting environmental programs.
“These new products will improve how we use satellite data to detect physical changes across Australia in exceptional detail,” he said.
“Detecting these changes is really important as it provides Australian governments, industries and individuals with high-quality data and tools to make policy and investment decisions.We’ve already had farmers on the ground say they can use NationalMap to see the history of their land so they can be better prepared for changes in climate and water availability, and government agencies have also been successful in tracking water released for the environment through river systems in the northern Murray–Darling Basin,” he said.
Kershaw said that Geoscience Australia were now working with FrontierSI to engage Australian businesses and demonstrate how they can use DEA to develop new commercial applications of its free-to-access data.
“Australia has a rapidly growing digital economy and space sector. We want to be able to incubate new ideas, build new products and tools, and see where it can take us,” he said.

Sentinel 2 false colour image produced by Geoscience Australia of Port Alma, in Queensland, Australia, showing Salt pans, mangroves and tidal flats at high tide.
Sentinel 2 Surface Reflectance
Near-real-time processing capability for data from the European Space Agency’s Sentinel-2 satellite constellation is now available in NationalMap, meaning users now have access to higher resolution and more readily-available images.
Mr. Kershaw said the new imagery is prepared for Australian conditions and provides a five-day update of every point in Australia at 10-metre resolution – about the size of an AFL goal square.
“This data is available via the NationalMap portal within thirty six hours of acquisition and meets the requirements of a number of government agencies,” he said.
“It has already been successful in monitoring water flows in the Barwon River, irrigated cropping in the Namoi region, and the Clarence Valley bushfires near Grafton.”
Surface Reflectance corrections are applied to satellite data to account for variations caused by atmospheric properties, sun position and sensor view angle at time of image capture.
These corrections have been applied to all satellite imagery in Geoscience Australia’s Landsat archive since 1987, and Sentinel-2 archive since 2015. This allows comparison of imagery acquired at different times by different sensors, in various seasons and in geographic locations, providing a richer and deeper pool of data for analysis.

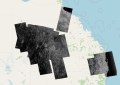
The above WOfS image shows the Menindee Lakes in western New South Wales, illustrating the lack of permanent water in a set of lakes along the Darling River, which provides Broken Hill with its water supply. The small number of areas shown in blue and purple colours, and the large amount of red to green colours, shows that for most of the last 30 years, the Menindee Lakes has been a largely ephemeral lake system.
Water Observations from Space
The Water Observations from Space v2.0 (WOfS) update provides surface water observations derived from satellite imagery for all of Australia from 1986 to present.
Mr. Kershaw said the data have been a key component of the Australian Flood Risk Information Portal developed by Geoscience Australia, and are now available on NationalMap.
“This new release allows users to get a better understanding of where water is normally present in a landscape, where water is seldom observed, and where inundation has occurred occasionally,” Mr Kershaw said.
“It shows water observed for every Landsat-5, Landsat-7 and Landsat-8 image across Australia (excluding External Territories) for the period of 1986 to 2017.”
WOfS is updated automatically and analysed for the presence of water. This information is added to the product in near real time as a satellite acquires data.
The original purpose of the WOfS product was to help understand where flooding may have occurred in the past,which has a key application in emergency management and risk assessment.
The product also has many other uses, including showing how permanent surface water is in the Australian landscape for water management and mapping. It has also been used for wetland analyses, water connectivity and surface-ground water relationships.

Changes in the Roper River estuary and surrounding coast between 1987 and 2010. The first row shows false colour imagery from the month of October in the years of interest as a visual reference point. The second shows the extent of each mangrove class (woodland, open forest, closed forest) for each reference year.
Mangrove Canopy Cover
NationalMap users now have access to valuable information about the extent and canopy density of mangroves for each year between 1987 and 2016 for the entire Australian coastline.
It consists of a sequence (one per year) of 25 metre resolution maps that are generated by analysing the Landsat fractional cover product developed by the Joint Remote Sensing Research Program, and the Global Mangrove Watch layers developed by the Japanese Aerospace Exploration Agency (JAXA).
Mr. Kershaw said the annual maps of mangrove extent and cover for Australia are the first to be generated at a continental scale and on an annual basis.
“In Australia, mangroves are protected under legislation and we know there have been changes to their extent since 1992,” Mr Kershaw said.
“Mangroves provide a number of services, including carbon storage, coastal protection, nurseries for important fish and prawn species, and also habitat for migratory and endemic bird species.
“These new maps of mangrove extent can be used to see how mangroves respond to disruption events such as severe tropical cyclones, and they can also be used to improve our understanding of the ecological benefits provided by mangroves.”
Surface Reflectance Geomedian
The Surface Reflectance Geometric Median (geomedian) update will be primarily used for change detection, and for broad regional image composites, such as national and continental mosaics.
It is a set of pixel composite mosaics of annual time series of Earth observations since 1988 –essentially a national mosaic of the statistical median of all observations for each particular image pixel from a period of time.
Mr. Kershaw said that in the update, the annual geometric medians of surface reflectance measurements are calculated per calendar year, on individual satellite sensors.
“For example, the 2016 Landsat 8 geomedian image over an area will be the composite of medians of Landsat 8 pixels observed for that area in 2016,” Mr Kershaw said.
“In order to create a meaningful geomedian, a median pixel must take all concurrent spectral measurements into account simultaneously as a multi-dimensional set, rather than measure each independently.”
An advantage of the geomedian over other pixel compositing techniques is that the geomedian is a robust statistical measure, enabling further analyses to be undertaken.
It is a suitable product for principal components analyses, Kauth-Thomas transforms and other linear analyses common to remote sensing investigations.
These four new product releases add to the growing number of products already available via NationalMap, including Landsat Surface Reflectance, and the Intertidal Extents Model (ITEM) and High and Low Tide Composites products, which analyse and visualise Australia’s dynamic coastal zone.
Stay up to date by getting stories like this delivered to your mailbox.
Sign up to receive our free weekly Spatial Source newsletter.