Bloomberg CityLab
How were the landscapes of our lives reshaped by the pandemic? For the better part of the last year, Bloomberg CityLab asked its readers to create their own maps that show what their worlds look like after coronavirus and its coinciding economic, environmental and social sea changes.
 Maps Mania
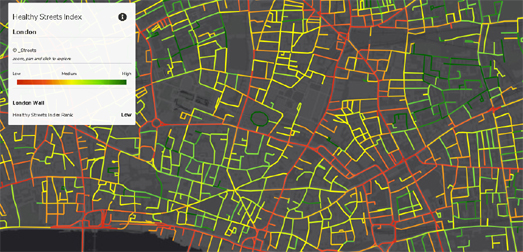
University College London (UCL) has released a new interactive map which rates London’s streets based on how ‘healthy’ they are. The Healthy Streets Index ranks every single street in Central London based on ten different indicators.
 Map of the week
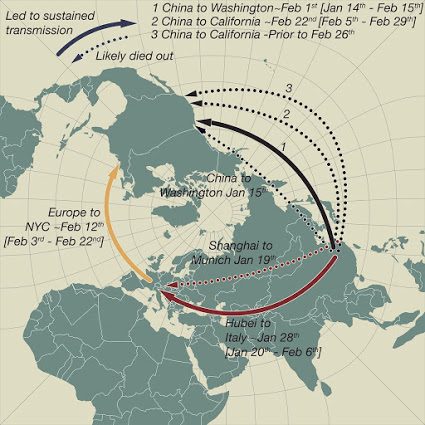
A year ago the COVID-19 pandemic made its first inroads into the United States. The virus was first found in Washington State in late January-early February. Science Magazine details the routes the virus took and includes this map.
Maps and mappers of the 2021 calendar: Valters Zeizis, cover

GeoHipster
GeoHipster interview with Valters Zeizis of the Latvian met-office.
 The Map Room
Jonathon Crowe compiles a collection of essays about how maps have been used to depict time.
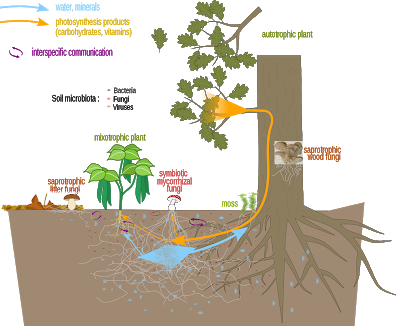
Map of the week
Digging in to the underground network created by fungi to transfer nutrients, minerals, water and even information among and between tree species.
Stay up to date by getting stories like this delivered to your mailbox.
Sign up to receive our free weekly Spatial Source newsletter.