This article will appear in full in the June/July issue of Position magazine. It was written by J. Gabriel van Wyk, Lead Geospatial Solutions Architect at Open Spatial Australia.
On the back of storms thrashing Australia’s east coast, some lessons learnt from an even bigger storm become all the more poignant. In February, Fiji was pummelled by the largest cyclone in recorded history to hit the South Pacific. Lead Geospatial Solutions Architect at OPEN SPATIAL AUSTRALIA Gaby van Wyk travelled to Fiji to assist remediation work following the devastation of Cyclone Winston, learning some valuable lessons to consider before disaster strikes.
I recently had the privilege of assisting Fiji with restoration work after Cyclone Winston had devastated a large part of the island nation. Cyclone Winston was the largest cyclone ever to make landfall in the south Pacific basin with windspeeds recorded up to 306km/hr and damage estimated in excess US$1.4 billion and 44 tragic fatalities.
My task was to work with the spatial team at the Water Authority of Fiji (WAF) to combine, extract and analyse information from the different GIS datasets available to them.
Before I dive into some technical detail, I would like to recount some of my personal experiences. Driving through affected areas I could not help but to be awed by the sheer destructive power of nature. Yet, I was amazed at the resilience with which people rose to the challenges thrown at them.
Figure 2 shows children playing on what is left of their family home. By this time, ten days after the storm, their dad had already used the debris from the house to construct a temporary shelter for the family. Imagine sheets of corrugated iron flying through the air at speeds of over 300km/hr. Apart from the many broken poles, there were countless metal objects embedded in the electrical grid delivery network, making complete restoration of electricity a real challenge for the Fiji Electricity Authority.
The Prime Minister of Fiji assembled a task force that met daily to report on progress and determine priorities and objectives for different ground crews. Broadly speaking, our team’s objectives were to provide the Prime Minister’s Recovery Taskforce with supporting information and to assist the WAF ground crews with information..
“The problem was an intensely spatial network problem.”
The recovery taskforce needed information to understand the extent of the problem in terms of people affected and work order priorities. This translated, amongst other things to the impact on the population. In reality, the real impact had many different aspects. The first task was to qualify the impact, in terms of the destruction. This of course was something that was best done remotely.

Figure 2: Children playing on what is left of their family home.
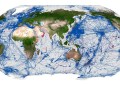
DigitalGlobe started the work by providing images from before and after -for free. These were used to do difference analysis and the results were then reviewed from helicopters. Figure 3, produced by the Pacific Development Community, is an example of one of the resulting datasets and indicates the damage to each building.
This data was ideal for further analysis, but for WAF access to the data was a rather difficult task, initially. Upon arrival, I found that my Fijian colleagues were unaware of the work done by DigitalGlobe. We tried to work through their Fijian connections, but initially that was unsuccessful. It was quicker to get my colleagues at Open Spatial to get in touch with Peter Kinne from DigitalGlobe and access the imagery that way.
Once found, the Fijian source was keen to collaborate. So what is the problem here? A national SDI (Spatial Data Infrastructure), or at least an extensive collaboration framework between agencies within a country, is perhaps more important than what we usually think, especially during the easy days when there is no crisis to deal with.
When tragedy strikes, everyone operates in acceleration mode, solving the immediate problems, perhaps not thinking about the data needs of others. At such times, we must be prepared – not scramble to get prepared.
In Fiji, there seemed to be good collaboration with some agencies, and those collaborations truly paid off. However, this was not the case everywhere, as a few of the data custodians were oblivious to the data requirements and work done in other parts of the industry.
A national SDI could have provided a single point of access and truth for all available national datasets. It would have allowed different agencies to understand the bigger national picture and their role in it. Water Authority of Fiji is tasked with the provision of fresh water and their Restoration Objectives were the following:
- Establish contact with all villages to assess the criticality of the situation in that village.
- Establish access to drinking water for all people. Because of the enormity of the task, access to drinking water is defined as the initial availability of a single water point, per village. The importance of this is that at least the people have water and can stay healthy. We need to understand that this is far from having running water in one’s home. This is one water source situated somewhere in the village, and people may still have to go and fetch water for home use from that point.
- Repair the damaged system. Once all villages have been given access to fresh drinking water, the real task of repairing the damaged networks can begin.
The tasks of the ground crews were not as straight forward as some may think and this was not just due to the very rugged topography of these volcanic islands. The impact of the storm on the people went far beyond just the damage to houses.
Let me explain – access to fresh water originates from a series of water sources (water treatment plants) that are connected with water storage facilities (tanks, towers). These are all connected and feed water to people’s homes via a water mains pipe network. From the water mains, water service connections provide water to the homes, passing through a water meter. The problem was an intensely spatial network problem.
Unlike hierarchical drainage networks like rivers or waste water, potable water mains networks often loop back on themselves providing multiple ways in which water can get to particular points in the network. A series of valves allow the water engineers to isolate parts of the network, whilst the loopbacks ensure that water gets to all points, not part of the isolated damaged segments. A house or a village may be completely intact. However, if the water supply sources to the house or village were affected elsewhere, it means that the people were also without fresh water.

Figure 3: Building Damage Assessment, showing destroyed (red), damaged (amber) or intact (green) buildings. More information: http://gsd.spc.int/winston/.
Network analysis techniques were used to determine the affected households, whether damaged or not. To get the correct results for this type of analysis, spatial datasets with high levels of completeness, accuracy and topological integrity were required. Mr Josua Wainiqolo is the GIS Administrator at WAF and one must give credit where it’s due. He and his team are a well organised and efficient group of professionals who went above and beyond. They have systems in place that ensure that when we needed to do some of the most complex network traces, we got the correct results. But this was where the fun started.
Our analysis included the water meters on affected properties. To validate our results I wanted to reference other datasets which I had access to. However, very little metadata was available. One dataset in particular was provided in two overlapping SHP files. These contained the same class of information, but they were different. Neither had associated metadata.
Overlaying these with datasets from other organisations proved to be rather interesting. For example, most water meters were GPS verified and fell outside village or property boundaries. Nor did it look like there was any correlation with electricity supply networks.
In the end, we managed to provide the results needed, but things could have been easier. This highlights the challenge of bringing disparate datasets together at short notice in an emergency and then having to make decisions based on that data.
The remainder of this article–including van Wyk’s key lessons learnt from the experience–will appear in the upcoming issue June/July issue of Position magazine. Be sure to subscribe to access all that the Position Media Network has to offer.