During the 1997/98 El Niño event, billions of dollars of damage was casued around the Pacific region. With climate change advancing, it is crucial that El Niño and La Niña events are carefully studied to limit the effect of future effects.
To facilitate this, Australian researchers from the National Computational Infrastructure (NCI) and the ARC Centre of Excellence for Climate System Science have produced a remarkable high-resolution animation of the largest El Niño ever recorded.
So detailed is the animation that it took 30,000 computer hours crunching ocean model data on Australia’s most powerful supercomputer, Raijin, before it could be extracted by the NCI visualisation team to produce the animation.
Raijin is the same computing infrastructure that will be used for Australia’s impending dynamic datum to perform the daily coordinate adjustments as Australia’s continent drifts north east.
As the planet warms it also appears that the swings between the two extremes, from El Niño to La Niña like the 1997 to 1999 sequence, will become more frequent.”
The 97/98 El Niño event was linked to massive forest fires in Indonesia, catastrophic flooding in Peru and the first major global coral bleaching event that killed 16% of the world’s corals in a single year. Researchers believe the model confirms that better observation systems can help us forecast these events earlier.
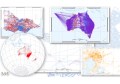
“The animation shows how shifting pools of warmer or cooler than average water 300m below the surface of the ocean can trigger these powerful events,” said Dr Alex Sen Gupta, a member of the visualisation team from the ARC Centre of Excellence for Climate System Science.
“When these pools of water burst through to the surface and link up with the atmosphere they can set off a chain reaction that leads to El Niños or La Niñas.”
Get stories like this delivered to your mailbox every week.
Subscribe to the free SpatialSource newsletter.
The El Niño animation looks beneath the ocean surface to reveal the oceanic processes that led to the 1997/98 El Niño event, and casts light on what we can expect from future events.
“The animation shows us that a well-developed deep ocean observation system can give us advance warning of extreme El Niños and La Niñas,” said team member Dr Shayne McGregor from Monash University.
“Preserving and expanding the currently sparse observation system is critical to improving our seasonal prediction capability in the future.”
The underlying ocean model for the animation uses a 30km horizontal grid and splits the vertical depth into 50 cells, which was processed using the Raijin supercomputer. This allows researchers to analyse the El Niño and the subsequent La Niñas at a higher resolution than before possible.

The naimation was created by Australia’s most powerful supercomputer, Raijin, which will also be used for Australia’s impending dynamic datum.
“Raijin gives us the capacity to model complex global systems like El Niño that require a high resolution for a better accuracy,” said Associate Prof Andy Hogg, a member of the team from the Australian National University.
“It was these huge volumes of data produced by the model that meant we needed the specialist visualisation expertise from NCI to reveal what happened in detail.”
Findings by CSIRO and the University of New South Wales suggest that ‘super’ El Niños like the 97/98 event are likely to become more frequent as the climate warms.
A member of the visualisation team, Dr Agus Santoso found in 2013 that as the climate warms, we are likely to see noticeable changes to El Niños.
“As the planet warms it also appears that the swings between the two extremes, from El Niño to La Niña like the 1997 to 1999 sequence, will become more frequent,” said Dr Santoso from the University of New South Wales.
“For this reason and many others a reliable early warning of El Niño and La Niña will be vital for farmers, industry groups and societies to be better prepared for the extreme conditions they inevitably bring.”