The Terrestrial Ecosystems Research Network (TERN) has released a package for open source statistical analysis software R, enabling local analysis of TERN’s wealth of cloud-hosted data.
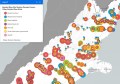
The newly released AusPlotsR package allows users to extract, prepare, visualise and analyse live data from over 600 live monitoring plots that TERN manages.
The package allows users to leverage R’s powerful inbuilt functionality to facilitate live manipulation of ecosystem surveillance data, including physical sample barcode numbers to link with TERN’s Ecosystem Sample Library.
A library of functions in the package handle many of the most common pre-processing stages required to compile observations and greatly simplify creating multi-faceted data tables for analysis, including diversity indices, vegetation structure, classification, ordination, species accumulation, growth forms, tree basal area and fractional ground cover.
AusPlotsR and its documentation can be downloaded via Github.
Stay up to date by getting stories like this delivered to your mailbox.
Sign up to receive our free weekly Spatial Source newsletter.