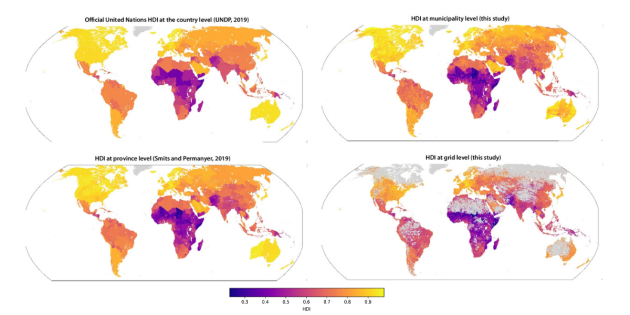
Researchers have used satellite imagery and machine learning to estimate Human Development Index (HDI) scores for 61,530 municipalities and counties worldwide.
The results of the study, published Nature Communications, show that more than half the global population lives in municipalities where the development tier is different from the tier assigned at the national level… highlighting how finer-grained data can change the picture within countries.
In states and provinces that conventional assessments placed in the bottom two of five development tiers, about 8.5% of residents shifted to the top two tiers under the new municipal-level analysis.
The mismatch grew to 13% when researchers estimated development for 10-by-10-kilometre grid tiles, roughly equivalent to the area of Paris.
While more granular than earlier estimates, the new data do not reveal information about individual households or neighbourhoods. But they could help to guide efforts to make aid programs more effective.
“We frequently target policies and programs based on these aggregate statistics, but we want to support the people who need it, not only the countries that need it,” said study co-author Solomon Hsiang, a professor of environmental social sciences in the Stanford Doerr School of Sustainability.
‘Multiple shocks’
“It used to be the case that the performance of countries was assessed mainly through income and economic growth,” said study co-author Heriberto Tapia, who leads research and strategic partnerships for the United Nations Development Program’s Human Development Report Office.
“The human dimension, what was happening with people, was often lost in the policy design.”
Even proponents of the index have long recognised shortcomings, however. Relying on national averages can obscure inequality and opportunities to improve policies within countries. Data gaps persist in the poorest nations, where only about half have conducted a census in the last decade.
Satellites generate more data daily than all social media combined, Hsiang said, yet those archives remain largely untapped.
In 2020, Hsiang, Tapia and collaborators set out to determine whether this imagery could be used to improve the spatial resolution of official UN data.
“Our ambition is that, thanks to these estimates that are very granular, people in different localities around the world will be able to assess what is happening with their human development following the same standard,” Tapia said.
“We are in this particular moment when human development in the world is slowing down, and we suspect one of the reasons is because there are multiple shocks that are taking place in different parts of the world,” Tapia added.
“Many of these shocks have to do with climate hazards.”
Computer challenge
The researchers trained a machine learning model on satellite images of states and provinces alongside survey-based data from each country, including official HDI data from the United Nations.
Because provinces are so large and have irregular shapes rather than the neat rectangles typically used in computer vision, the researchers were initially surprised their machine learning approach worked at all, said study co-lead author Jonathan Proctor, assistant professor in food and resource economics at the University of British Columbia.
The model learned to recognise relationships between HDI and certain visual features in the images, and the team then applied it to predict HDI around the world using satellite images of municipalities and counties.
“Almost all the data that we have about the world is collected from household surveys that are then aggregated up to some convenient administrative area,” said lead study author Luke Sherman, a data scientist in Hsiang’s Global Policy Laboratory at Stanford.
“We showed that with satellite imagery, it’s not particularly hard to have an approximate estimate of the same variable, whether it’s school enrolment, educational attainment, or HDI, at a much finer resolution.”
In a recent pre-print, the team shared preliminary results from testing the model on more than 100 variables, finding that the technique can accurately predict a wide range of variables, including crop yields, asset ownership like cars or livestock, and electricity access.
This suggests the tool could be used to increase the resolution of other types of administrative data at relatively low cost.