Two new datasets map and reveal the extent of ecosystem disturbance across Australia.
They also show that while about 30% of the country is still free or almost free of human-induced environmental pressures, many landscapes are becoming increasingly fragmented.
According to lead author, Dr Ruben Venegas-Li from UQ’s School of the Environment, the publicly available datasets could be vital in guiding conservation planning and keeping the landscape intact.
The research report has been published in Earth System Science Data.
Operating on old data
“Australia is facing an extinction crisis with more than 2,100 species and 100 ecological communities federally listed as threatened and at least 103 species [have] became extinct in the past 250 years,” Dr Venegas-Li said.
“We need to be making informed decisions about conservation and development to proactively protect Australia’s flora and fauna, and datasets like this are part of the solution.”
Dr Venegas-Li says that previous national pressure maps were produced more than three decades ago.
On top of that, global maps leave out pressures applicable to the Australian context, such as mining and agriculture.
The new datasets, on the other hand, “give us a consistent, national way of estimating where human pressures are occurring, how intense they are, and how they overlap,” he said.
Safeguarding species
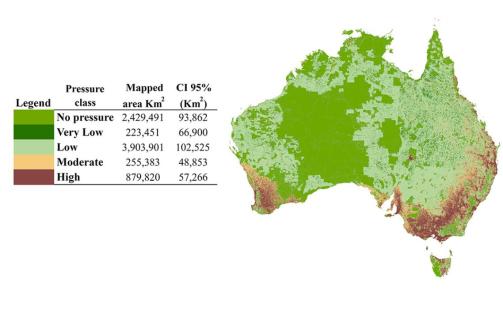
The Human Industrial Footprint (HIF) map consolidates 16 human-induced environmental pressures into a single, high-resolution picture of ecosystem disruption.
Those 16 pressures include: buildings, mining, farming, public infrastructure, the size of human population, forestry plantations, railways, hiking trails, roads and energy infrastructure.
In addition, the researchers developed an Ecological Intactness Index map, which quantifies the degree of habitat loss, quality and fragmentation across the continent.
Senior author Professor James Watson said the 100-metre detail in the datasets helps identify multiple environmental pressures within the same area.
“Two areas might both be used for grazing, but one could also have roads, dams, nearby settlements and other infrastructure,” Professor Watson said.
“By acknowledging all these pressures on the same map, we can better understand where ecosystems are likely to be under the greatest strain and also where places are still relatively free from these pressures.
“It is increasingly important to target these last remaining intact landscapes as they are critical for safeguarding species in a time of climate change.”
Other applications
Dr Venegas-Li said the datasets pinpointed where efforts were more needed and could support reporting and monitoring towards national and international conservation targets.
“Meeting targets like protecting 30 per cent of land by 2030 need to consider these types of maps, as they help identify critical habitat areas to conserve” Dr Venegas-Li said.
“Both datasets should be of interest to those involved in biodiversity management when considering Australia’s Strategy for Nature 2024–2030 Nature Positive Plan, as well as its global commitments to the Kunming-Montreal Global Biodiversity Framework.”
Dr Venegas-Li said that even beyond conservation policy, the HIF and EII have applications in environmental impact assessments, regional land-use planning, and climate adaptation and mitigation strategies.
“Integration into all levels of decision-making can help halt further biodiversity loss, improve connectivity between protected areas, and support sustainable development objectives,” he said.