The International Cartographic Association’s Commission on Cartography and Sustainable Development is making it easier to create maps that will help countries achieve the SDGs.
By Britta Ricker, University of Utrecht, and Carolyn Fish, University of Oregon
Maps and data visualisations are vital to understanding and communicating information about our changing world.
Children are suffering from malnutrition and limited access to water and education. Excessive fossil fuel emissions are causing climate change that is leading to disasters. Unprecedented environmental disturbances are causing risks to humans and our environment.
All these challenges can be addressed by sustainable development.
Sustainable development, while a hotly contested topic, refers to meeting the needs of the present without preventing future generations from meeting their own needs.
In 2015, as a part of the 2030 Agenda for Sustainable Development, the United Nations (UN) identified 17 Sustainable Development Goals (SDGs) to develop targeted global solutions for “peace and prosperity for people and the planet, now and in the future.”
The SDGs provide a framework for individual member states to measure how close or far they are from meeting the goals.
The UN developed and all member states agreed upon a set of 169 targets and 241 indicators to support this assessment… an impressive international relations feat. However, for individual countries to measure their progress towards these goals, they need to have data and information, and ideally, spatial data.
The SDGs are designed to improve health, education and economies while combatting inequality, climate change and environmental degradation… but often these problems are interconnected. Maps can show connections between problems and help people identify solutions together. They help to connect global issues with local solutions by providing a means to identify where current challenges persist.
A map can be used to model alternative futures as well as to represent past changes in the context of new realities. Maps can isolate specific variables, making complex situations more understandable by visualising spatial patterns from above in a way that can be read across different contexts.
Because the SDGs are interconnected, it is important to disentangle these connections to find achievable local solutions. Maps are an important tool for doing this, but making these maps is no easy task. There are countless methods for collecting the data required to make maps, not to mention different ways to visualise spatial data.
Other mapping challenges include questions about whose data and information are being mapped (for example how is a forest defined and by whom?), who controls the data (are these data shared between government agencies within the same country?), whether the data are accurate, or even whether the data exist.
The answers to these questions are especially important when making and using maps that guide the allocation of resources to people and countries with differing levels of access to economic and social capital.
The International Cartographic Association’s (ICA) Commission on Cartography and Sustainable Development is working to make it easier to create maps to support countries to achieve the SDGs. The Commission undertakes capacity-building events and conducts research in support of these aims.
Capacity building workshops
In 2023, prior to the International Cartographic Conference in Cape Town, South Africa, Robert Roth and Britta Ricker presented a two-day, hands-on workshop in Harare, Zimbabwe, hosted by Dr Prestige Makanga (CeSSHAR Zimbabwe) and Letwin Pondo (Midlands State University).
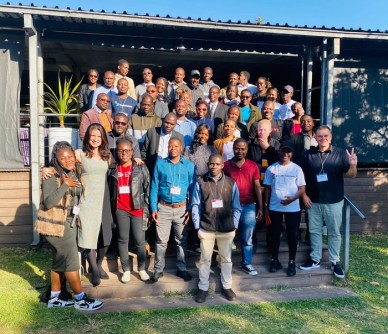
The workshop taught participants how to create maps from official UN SDG indicator data using free, open-source GIS software, following principles described in the open access book Mapping for a Sustainable World, jointly written and published by the ICA and the UN), and drew on tutorials that are freely available. You can read more about the impacts of this workshop in the participants’ own words.
Solving SDG mapping problems
Small island developing states (SIDS) face magnified sustainability challenges due to their small size, limited resources and geographic isolation. SIDS also struggle to collect their own SDG indicator data.
Because they are small in both area and population size, they are easy to overlook in a global context. On a global scale map, many islands become invisible. Good cartographic design can help make these countries’ sustainability challenges visible and understandable to a wider audience, supporting collaborative solutions and decision making.
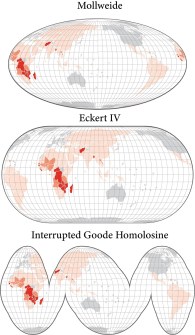
For instance, choosing a suitable map projection can change the focus of the map to islands around the world instead of the continents. Also, experiment with our interactive mapping tool that shows this and read more in the freely available paper.
In the example above, a choropleth map of SDG Indicator 1.1.1 (Percent of population below the international poverty line, 2016), the Interrupted Goode Homolosine map projection avoids placing the small island developing states (located in the Indian and Pacific Oceans and the Caribbean Sea) at the margins of the map.
It also illustrates the use of circular point symbols to show the indicator data for Small Island Developing States clearly at the global scale when their small sizes would otherwise make them invisible. Grey is used to indicate missing data while the three red shades show increasingly larger percentages of the population living in poverty.
Want to learn more or get involved?
If the work of the ICA Commission on Cartography & Sustainable Development described above sounds like something you’d like to follow or be involved with, please reach out to Britta Ricker (b.a.ricker@uu.nl), the chair of the Commission. And check out the Commission’s website (carto-sd.icaci.org) for important and upcoming information or if you would like to have your Commission-relevant work shared or featured.