 Maps Mania
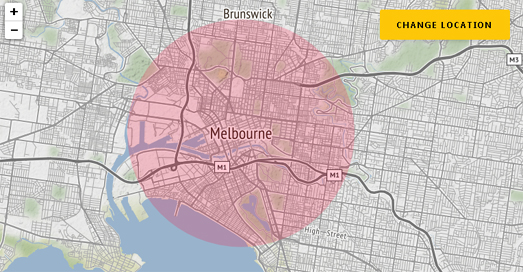
Due to a spike in Covid-19 cases the Australian government has introduced strict new lock-down rules in the city of Melbourne. There is also now a 5 km travel restriction in place. You can only exercise and shop for food within a 5 km radius from your home (except if the nearest supermarket is further than 5 km). ABC News has created a simple Leaflet.js interactive map which can show you this 5 km radius around your home.
 somethingaboutmaps
The final detail on Daniel Huffman’s An Atlas of North American Rivers, a stunning cartographic project rendering waterways in the style of public transport maps.
Georgia’s COVID-19 Maps: Bad Faith or Bad Design?
 The Map Room
In How to Lie with Maps, Mark Monmonier warns that map readers “must watch out for statistical maps carefully contrived to prove the points of self-promoting scientists, manipulating politicians, misleading advertisers, and other propagandists. Meanwhile, this is an area in which the widespread use of mapping software has made unintentional cartographic self-deception inevitable.”
So which of these two scenarios—careful contrivance or unintentional self-deception—is at play on the Georgia Department of Public Health’s COVID-19 daily status report page?
Mapping Worldwide effects of COVID-19

Image: CSIRO.
Map of the week
COVID-19 Dashboard is a concerted effort between the European Space Agency (ESA), Japan Aerospace Exploration Agency (JAXA), and National Aeronautics and Space Administration (NASA). It combines the resources of these three agencies to visualize the environmental and economic effects of the COVID-19 pandemic.
 Maps Mania
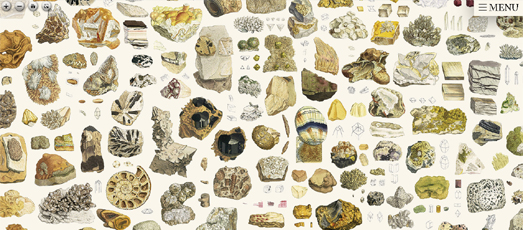
Last month in Microscopic Mapping I looked at a number of examples of mapping libraries being used to map and visualize high resolution imagery of cells, tardigrades and insects. Now it is the turn of minerals.
British & Exotic Mineralogy is a beautiful visualization and map of James Sowerby’s astonishing 19th Century drawings of minerals. This ‘interactive map’ allows you to zoom-in and explore 2,242 illustrations of minerals made by James Sowerby’s between 1802–1817. The map is interactive, which means you can click on individual minerals to read James Sowerby’s own original notes on the selected illustrated mineral.
Stay up to date by getting stories like this delivered to your mailbox.
Sign up to receive our free weekly Spatial Source newsletter.