On the Grid: Visualising Street Network Orientations Across 50 Global Cities

99% Invisible
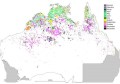
At a glance, the overall pattern formed by these first 25 polar histograms (or: rose diagrams) is clear: orthogonal grids, mostly aligned with cardinal directions in orientation, dominate American cities. There are exceptions, but most streets run north, south, east and west.
Bill Dollins: “’GIS’ as a distinct technological entity is disappearing”
 Geohipster
“It’s been observed over the last few years that spatial technology is becoming more componentised and spatial analysis is getting embedded within other software tools. This is probably most obvious in things like R and Pandas, which present as more traditional statistical and data analysis tools, rather than primarily as a GIS. It is possible to do sophisticated spatial analysis in those environments, but they don’t drag along all of the overhead of an ArcGIS or a QGIS. I think that trend is accelerating.”

The Map Room
In preparation for future missions to Europa, a new study, using Galileo and Voyager data, tries to map where the radiation is most intense on the Europan surface, as well as how far that radiation penetrates beneath the surface. If there’s life on Europa, it’s probably where the radiation isn’t.
The World According to Strabo
Google Maps Mania
The title ‘Father of Geography’ could be given to the Greek philosopher, historian and geographer Strabo. Strabo lived during the transitional period when the Roman Republic developed into the Roman Empire. He is most well known for his ‘Geographica’, an historical and descriptive account of the people and places living in the different regions of the western world, during his era.
Jug Cerović Maps the Singapore MRT

The Map Room
Jug Cerović’s map of the Singapore MRT is a gem—literally.
Stay up to date by getting stories like this delivered to your mailbox.
Sign up to receive our free weekly Spatial Source newsletter.