This article was first published in Issue 126 (Aug/Sep 2023) of Position magazine.
A case study of mangroves, coastal protection and accounting for Australia’s vast ocean ecosystems.
Article supplied by the Centre for Environment and Satellite Accounts, Australian Bureau of Statistics.
The oceans are still a largely an undiscovered resource. While there are ongoing efforts across government and the scientific community to improve our knowledge, we are still far from having a comprehensive understanding.
A consistent understanding of our ocean ecosystems and their value allows us to better support the management of a healthy and resilient ocean, make informed decisions on a range of ocean-related policies, and measure their progress over time.
First released in August 2022, the National Ocean Accounts — a collaboration between the Australian Bureau of Statistics (ABS) and the Department of Climate Change, Energy, the Environment and Water (DCCEW) — provide an insight into some of Australia’s key blue carbon ecosystems including mangroves, saltmarsh and seagrass.
Blue carbon ecosystems are coastal or marine ecosystems that sequester (capture and store) large quantities of carbon in both the plants and the sediment below. The Ocean Accounts describe the extent and condition of each ecosystem, as well as some of the ecosystem services they provide — namely, carbon stock, carbon sequestration and coastal protection services.
Ocean accounts provide organised environmental-economic information that describes our relationship with the ocean. The Ocean Accounts are based on the United Nations System of Environmental-Economic Accounting – Ecosystem Accounting. This framework provides a standardised approach to uncovering the interactions between ecosystems and the economy by looking at how ecosystems contribute to human well-being in the form of identifiable ecosystem services.
In 2018, Australia became a member of the High Level Panel for a Sustainable Ocean Economy. Accounting for the coastal and marine environment is a key component of Australia’s participation in this panel. Work on the Ocean Accounts began in October 2021, with an extensive stakeholder consultation process and advice sought from ecological experts to ascertain the most appropriate data sources and metrics to use in the accounts.
As a new account, the Ocean Accounts are experimental in nature and a main objective was to establish baseline estimates for future work.
Coastal geographies and Earth observation data
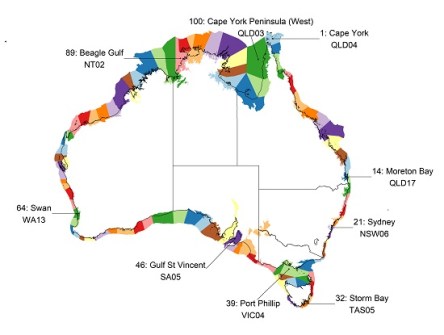
When producing any kind of environmental-economic account, it is necessary to define the scope of the area under investigation. The Ocean Accounts are presented at national, state and regional scales. They include Australia’s marine waters out to the Exclusive Economic Zone (EEZ), but exclude external territories such as Antarctica. State and territory boundaries for offshore areas were defined under the Offshore Petroleum and Greenhouse Gas Storage Act, while for regional-level reporting, we used Geoscience Australia’s Primary Sediment Compartments. These are part of a hierarchical structure that divides coastal zones on the basis of key environmental attributes to assist with coastal planning and management.
Data for the Ocean Account was integrated from a variety of sources, including Earth observation products, for each of the blue carbon ecosystems under investigation. For mangrove extent and condition accounts, we used the Mangrove Canopy Cover product from Digital Earth Australia (DEA), managed by Geoscience Australia. This dataset provides data about the extent and canopy density of mangroves for each year from 1987 to 2021 for the entire coastline of Australia. It consists of an annual sequence of 30-metre-resolution maps. These maps are generated by analysing the Landsat fractional cover product developed by the Joint Remote Sensing Research Program, and the Global Mangrove Watch layers from the Japanese Aerospace Exploration Agency.
All extent datasets were reprojected to the Geocentric Datum of Australia 1994 (GDA94) with Australia Albers EPSG3577 projection and then combined on a per sediment region basis.
Coastal protection: a case study in mangroves
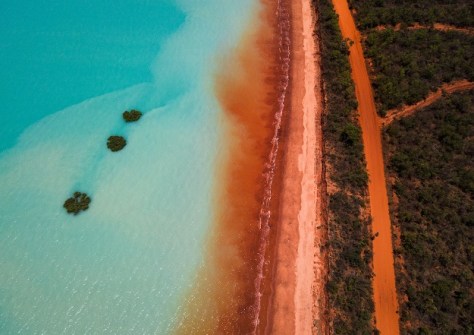
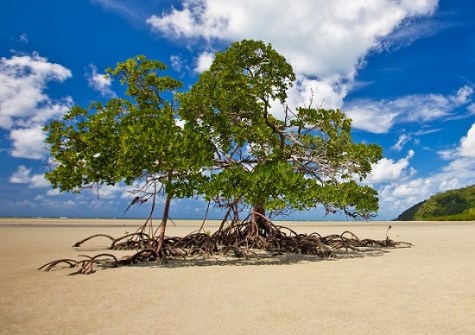
Mangroves thrive in salt and brackish water and form unique intertidal forests at the edge of land and sea. Almost exclusively tropical, they also occur in the subtropics. Mangroves provide coastal protection by acting as a living seawall, tempering floods during storm surges and slowing erosion. Mangrove forests also trap sediment, which helps the process of accretion, whereby coastal sediment returns to the visible portion of a beach or foreshore after a submersion event.
Coastal protection services may be afforded to communities from either mangroves, saltmarsh or a combination of both. You can read about saltmarsh coastal protection services in phase 2 of the Ocean Account.
How many mangroves protect Australia’s coast?
In 2021, there were 1,065,500 hectares of mangroves covering over 18,000 km of Australia’s coastline. This was made up of closed forest (54%), open forest (31.7%) and woodland (14.3%). Mangroves were predominantly located in the Northern Territory, Queensland and Western Australia, which account for almost 97% of mangrove ecosystems nationally.
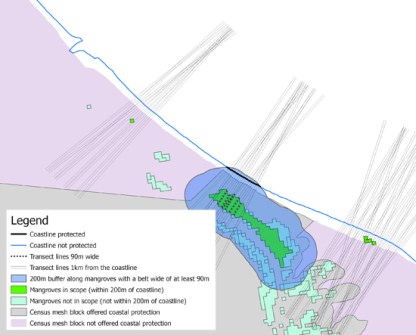
We used a simple model to determine which of these mangroves provided coastal protection. Mangroves that were within 200 metres of the coastline and had a belt width of at least 90 metres were assumed to provide protection services up to 1 km from the coastline.
In 2021, more than 85,000 homes and 175,000 people were protected from storm surge by over 18,000 km of mangroves. The majority of these dwellings (52,000) were in Queensland.
To arrive at these figures, we counted all Mesh Blocks which were within 1 km of the coastline of mangrove patches considered to be providing coastal protection. We then added together the population and dwelling count for each of these Mesh Blocks, based on 2021 Census data, and aggregated population and dwelling counts by state and Primary Sediment Compartment.
Mesh Blocks are the foundation of the hierarchy of geographical areas defined by the Australian Statistical Geography Standard (ASGS) and are designed where possible to contain 30 and 60 dwellings. As some mesh blocks in regional areas with low population density are very large and cover more than the 1 km radius considered in scope, this could lead to an overestimate of dwellings and population protected in these regions.
Replacing mangroves with seawall: an economic thought experiment
One way to estimate the value of an ecosystem is to calculate the cost to replace the service it provides, as recommended by the UN System of Environmental Economic Accounting – Ecosystem Accounting. We ascertained that it would cost Australia over $200 billion to replace mangroves providing coastal protection with seawall.
This cost was calculated by multiplying the cost per metre of seawall construction (estimated at $11,600) by the total length of coast protected by mangroves. We also considered the annual service cost for this extent of seawall, based on seawall infrastructure being expected to last between 25 and 100 years, or a mean lifespan of 62.5 years. The minimum and maximum annual service cost for seawall was found to be $2.2 billion and $8.7 billion respectively.
Figures for the cost and longevity of seawall were based on estimates provided by Ware and Banhalmi (2017).
Other ecosystem services: carbon stock and sequestration
Capable of storing up to four times more carbon than terrestrial forests, blue carbon ecosystems play an important role in climate change mitigation. Australia is considered a ‘blue carbon hotspot’ and holds about 7 to 12 percent of global carbon stock.
The Ocean Accounts include estimates of blue carbon stocks and carbon sequestration for three ecosystems: mangrove, saltmarsh and seagrass.
For carbon stock figures, we calculated an average value of carbon per hectare for mangroves, saltmarsh and seagrass, based on estimates by Young et al. (2021). We then applied these numbers to extent data to produce estimates for the whole ecosystems. For mangroves, a huge 243 million tonnes of carbon were being stored as of 30 June 2021.
We also calculated figures for carbon sequestration — that is, the gross amount of carbon captured and stored by an ecosystem in an area over a period of time — split according to carbon sequestered in soil and in vegetation. The Ocean Accounts provide figures for gross rather than net sequestration. Net sequestration also accounts for the quantity of carbon naturally released from an ecosystem over a time period.
Ocean Accounts going forward
There is still a long way to go in developing a full suite of ocean ecosystem accounts for Australia, allowing us to better manage our ocean ecosystems, resources and the economy.
There are some significant data gaps in the first National Ocean Ecosystem Account which affected our ability to produce estimates with a high level of confidence. Even for seagrass — a relatively shallow water ecosystem which is much more accessible than those deep in the ocean — the 30-year span of available data only covers those seagrass meadows located in the easiest to reach sites, meaning we don’t have good data on much of Australia’s vast coastline.
Going forward, our priority is to focus on obtaining more comprehensive data, as well as methodological refinement. We used experimental methods to integrate multiple sources where data was available, or otherwise model metrics where feasible. We hope that the simple models developed in this first experimental account will act as a starting point for improving our methodological approach, as we continue to consult with experts and users and receive valuable feedback.
Although the Ocean Accounts cannot change the way we interact with oceans in and of themselves, they provide highly valuable information to decision makers across government and industry who have the vision to maximise the potential of our natural resources.
You can read more about the National Ocean Account, including full results and methodology, at abs.gov.au/statistics/environment/environmental-management/national-ocean-account-experimental-estimates/latest-release#key-statistics. Comments and feedback can be sent to environment@abs.gov.au.