Each week, Spatial Source finds the best that the internet has to offer.

Population density maps tend to be boring and ugly. That’s why Róbert Szűcs, a GIS Analysis from Hungary, decided to change that and create a stunningly eye-opening map that can now even be purchased on Etsy. What may surprise a Westerner is the relative ‘darkness’ of the Americas and even Europe, compared to places like India, Eastern China and the island of Java in Indonesia. [Geoawesomeness]

Scientists from the CSIRO are using cutting-edge technology to map the seafloor of the Queensland Basin to understand how the Great Barrier Reef responded to past climate change events. The four week expedition uses new multi-beam echosounders to survey the seafloor to the depth of about 11 kilometres — eight kilometres deeper than scientists could reach previously. While the reef is one of the world’s most studied ecosystems, its depths could still hold many surprises, including how resilient it might be in the future. [ABC News]

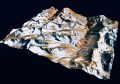
GIS experimentalist Andy Woodruff asked himself a simple question, if you poured water over the terrain somewhere in the world, where would it go? From that basic premise, he set out to map the watersheds of internationally iconic locations, and the results are visually stunning, such as for Mt Fuji above. [Andy Woodruff]

Many urban residents these days will find it hard to imagine a life without mobile apps that help us locate a restaurant, hail a cab, or find a subway station—usually in a matter of seconds. This prompted Xueman Wang of the World bank to ponder- if geospatial technology and data already make our everyday lives this easier, imagine what they can do for our cities. Perhaps, she says, they hold the answer to the world’s biggest problems. [World Bank Blog]

In the wake of the devastating Hurricane Matthew, you may wonder where else in the world is at risk. With NOAA’s Historical Hurricane Tracks it is possible to search for hurricane tracks on the map by location, name, year and by ocean basin. In all, the map tracks over 6,000 historical hurricanes around the world since 1842. As you can see, the most devastating appear regularly in two distinct regions of the world. [Maps Mania]