AUSPOS cluster processing is a decision of convenience rather than performance.
By Nicholas Gowans and Volker Janssen
AUSPOS is Geoscience Australia’s free online Global Positioning System (GPS) processing service. It takes advantage of the International GNSS Service (IGS) core network station data and products (e.g. final, rapid or ultra-rapid orbits depending on availability) together with Continuously Operating Reference Stations (CORS) in and around Australia.
Processing is based on static dual-frequency GPS carrier phase and code data of at least 1 hour duration (recommended minimum of 2 hours, maximum of 7 consecutive days). When submitting 30-second Receiver Independent Exchange (RINEX) data, users are required to specify the antenna type and the vertically measured antenna height from the ground mark to the Antenna Reference Point (ARP).
An AUSPOS report (PDF) is then emailed to the user, which includes the computed coordinates and their uncertainties, ambiguity resolution statistics, and an overview of the processing strategy. For advanced users, Solution Independent Exchange (SINEX) files containing more detailed information are also available for download.
AUSPOS datasets can be submitted and processed either individually or collectively in groups (clusters) of concurrent observations. In this article, we thoroughly test and quantify the effect of AUSPOS cluster processing by leveraging the extensive GNSS observation datasets held by DCS Spatial Services, a unit of the NSW Department of Customer Service (DCS).
AUSPOS cluster processing
AUSPOS data can be submitted and processed either individually (mark by mark) or collectively (in groups of concurrent observations). Individual, single-mark AUSPOS processing refers to the data collected at one survey mark being processed relative to the surrounding CORS network with no direct relationship to any other rover that was operating at the same time.
AUSPOS cluster processing considers that the multiple data files were collected during the same time window and are therefore correlated. Rather than individually connecting each user site to the surrounding CORS network, processing includes baselines between the user sites. In theory, this provides a stronger relative connection, provided all user sites are observed in a similar time window and the baselines formed between user sites are less than 20 km in length (Figure 1).

AUSPOS first detects which rover observed the longest, and this becomes the hub for the user data (regardless of the relative geometry of all user stations and CORS). In the ideal scenario, baselines are then formed between the hub and the surrounding CORS, while all other rovers are connected to the hub (provided there is sufficient data overlap).
AUSPOS accepts submissions of up to 20 RINEX files in one job, which are then processed together as a cluster, using an observation window that contains the collected data at all sites (between earliest start time and latest end time).
Individual observation sessions should overlap by at least 1 hour with respect to the hub, as this overlap is used to compute the baselines between user sites (and the direct L1/L2 ambiguity resolution strategy applied for short baselines is more reliable for data exceeding 1 hour). The baselines in the cluster are formed based on the maximum available number of single-difference observations (involving one satellite and two receivers).
If the data overlap of a particular user site with respect to the hub is too short, AUSPOS attempts to compute a baseline to another user site instead (Figure 2a). If this is unsuccessful, a baseline to a CORS is formed, thereby losing the desired relative connection (Figure 2b).

Positional Uncertainty
Positional Uncertainty (PU) is defined as the uncertainty of the horizontal and/or vertical coordinates of a point, at the 95% confidence level, with respect to the datum. It can be separated into Horizontal PU (HPU) for horizontal position and Vertical PU (VPU) for ellipsoidal height.
HPU is expressed as the radius of a 95% circle of uncertainty, generally calculated from the standard error ellipse produced by a least squares network adjustment. VPU is a linear quantity and obtained by scaling the standard deviation by 1.96 to convert it to 95% confidence.
AUSPOS calculates PU based on the East, North and ellipsoidal height coordinate uncertainties according to the Guideline for Adjustment and Evaluation of Survey Control, which is part of the Standard for the Australian Survey Control Network (SP1), version 2.2.
Cluster formation strategy
As the government agency responsible for the maintenance of the NSW survey control network, DCS Spatial Services maintains an extensive repository of GNSS observation data.
Using in-house generated Python code, it has been interrogated to automatically form clusters based on the following criteria:
- Each observation must have been processed through AUSPOS version 2.4 in single user station mode.
- Each observation may only be used in a single cluster.
- Each observation within a cluster must have a minimum overlap of at least 2 hours with the longest observation (hub) in the cluster.
- Each station within a cluster must be located no further than 10 km (a distance nominated by the authors) from the nearest user-submitted station.
- Clusters must not contain more than 20 user-submitted observations.
This strategy resulted in the formation of 909 clusters of two or more observations using 3,124 GNSS observation files. While the most prominent cluster sizes included 2 (51%), 3 (19%) and 4 (11%) survey marks, the largest cluster grouped together 17 marks.
AUSPOS processing strategy
Each cluster was processed through AUSPOS, with the resulting AUSPOS report and SINEX results being stored for analysis. Of the 909 clusters identified, five (0.6%) failed to process and 199 observations (6.4%) across 131 clusters processed with warnings of large PU.
Our goal was to evaluate the general performance differences between AUSPOS single and cluster processing, rather than reviewing outlier or worst-case events. Therefore, the failed clusters were discarded without further review, and the observations with large uncertainties were removed from the analysis. This resulted in 2,879 observation files producing results that could be validly compared.
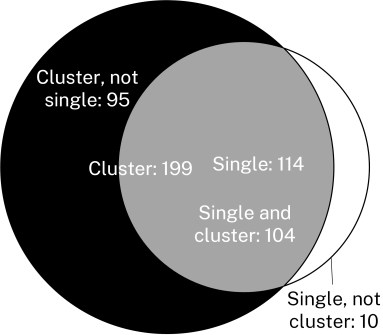
Observations receiving large-uncertainty warnings were tallied according to the processing strategy applied and visualised to illustrate when a station observation received a warning for large PU: in single mode processing, cluster processing, both, or one and not the other (Figure 3).

This simple analysis shows that clustered solutions are more prone to resulting in large-uncertainty warnings, particularly at user stations with less-than-ideal observing conditions (e.g. poor sky view due to tree cover or other obstructions).
This may be due in part to a different ambiguity resolution strategy adopted by AUSPOS with multiple submitted user stations as the baseline lengths within the cluster are shorter than those to the surrounding CORS. The short-distance, direct L1/L2 strategy applied for 0-20 km baselines may not perform as well in tough observing environments as the long-distance Quasi-Ionosphere-Free (QIF) strategy applied for 20-2,000 km baselines.
Acknowledging the number of observations containing warnings in the AUSPOS report, it is worth noting that even though these observations do not produce centimetre-level positions, they may still be useful for sub-metre applications.
Alternatively, the large-uncertainty warning may only be attached to the vertical component of the solution (generally due to a relatively short observation session affected by tree cover), while the horizontal component can still be considered fit-for-purpose.
Results of this nature are routinely assessed by DCS Spatial Services on a case-by-case basis. There is further utility in storing such observation data, considering that a result that fails (or produces warnings) today may become acceptable in the future as processing strategies are refined over time.
Analysis strategy
The quality of results from AUSPOS single-processing and cluster-processing solutions was examined in terms of coordinate changes, derived baselines between user-submitted stations, Positional Uncertainty (PU) and Relative Uncertainty (RU).
RU is calculated for a pair of survey marks (based on their PU and covariance) and can be separated into Horizontal RU (HRU) for horizontal position and Vertical RU (VRU) for ellipsoidal height.
All coordinates and quality values analysed were adopted from the GDA2020 SINEX files. Using the GeodePy Python library, PU and RU were computed from the variance-covariance matrix and expressed at the 95% confidence level.
Baselines between user stations were derived through coordinate differences from the SINEX files. Single-solution results were taken from their respective, discrete SINEX files and assumed uncorrelated (i.e. all covariances between stations are zero), while cluster-solution results adopted the relevant inter-station covariances as reported in the SINEX file.
Results and discussion
The four primary areas of interest (coordinates, derived baselines, PU and RU) show no significant change or improvement when AUSPOS cluster processing is employed. While there are some changes in the extremities of the distributions, these are not considered further because this study is looking for a clear trend.
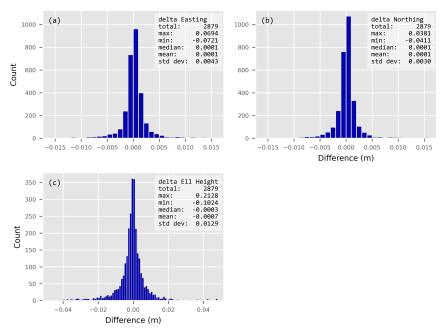
The mean and median changes for all coordinate components are less than one millimetre and well within the standard deviation of the distributions (Figure 4). This alone is sufficient to demonstrate that no significant difference is detectable between the two processing strategies based on the data available.

Similarly, when baselines are derived between AUSPOS user-submitted stations, the average changes in baseline components are sub-millimetric. This shows that even if a clustered solution might have a theoretically superior RU, no appreciable difference is evident in the actual relative positions.
The distribution of uncertainty was quantified via histograms of the obtained GDA2020 PU and RU values for single and cluster solutions. Inspection confirmed the high quality of AUSPOS solutions – with median values of about 0.017 m (HPU), 0.045 m (VPU), 0.022 m (HRU) and 0.059 m (VRU) – and that little change is present between the two processing modes.
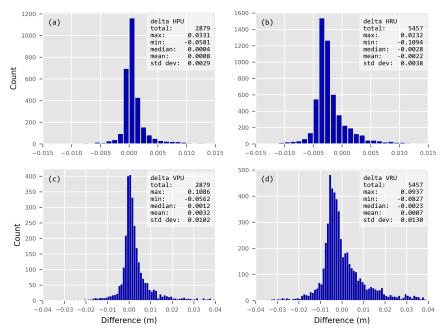
However, investigating the changes in uncertainty presented more mixed results (Figure 5). Cluster processing, on average, saw a very small degradation in horizontal and vertical PU while small improvements were observed in horizontal and vertical RU. Neither of these changes exceeded one-sigma of their distributions and therefore these changes are also considered statistically insignificant.

The most notable uncertainty improvement using cluster processing was a median change of 0.0028 m in HRU, falling comfortably within the one-sigma level of 0.0038 m. However, it should be noted that the improvement to RU is computed from uncertainties expressed at the 95% confidence level. When converted back to the one-sigma level, the difference is closer to 1 mm, which is an improvement of questionable value to any surveyor, for any application.
Such small improvement in RU may come as a surprise. On first consideration, one would expect that stations observed concurrently and processed together should have a more precisely determined relative position, which would yield improved RU.
However, the variance-covariance matrix provided by AUSPOS may not be well suited to RU computations due to the large number of constraints employed by AUSPOS. Surrounding CORS are constrained at 1 mm horizontally and 2 mm vertically (IGS stations) or 3 mm horizontally and 6 mm vertically (other CORS). This likely decorrelates the uncertainty estimates at the user stations, resulting in RU values that are almost indistinguishable from those obtained when the observations are processed as discrete single solutions.
This effect is readily seen in least squares network adjustments with very good connection to datum where the precision of the constraints ‘overpowers’ the measurements between stations. Even if this is the case, the minimal change in coordinates and relative position still supports the conclusion that AUSPOS cluster processing, in its current form, offers no real advantage over single processing.
On the other hand, the high quality of results in single mode across NSW may be in part due to the dense CORS network contributing to AUSPOS. The bar may be set so high that little benefit is gained with the supply of additional observations between user stations.
With no clear trend in RU difference between single-solution and cluster-solution, the change in RU was examined with respect to the distance between stations. No discernible correlation was evident.
Furthermore, it is noted that the full duration of each observation may not be utilised by AUSPOS depending on the observation overlap between stations forming a baseline. As such, the RU for each pair of stations was examined with respect to the overlapping observation time. Again, no discernible correlation was evident.
This supports our earlier assertion that the large number of CORS constraints can cause a decorrelation of the uncertainty estimates at the user stations. Similarly, no significant correlation was found between the change in RU and the cluster size.
Finally, the experiment was rerun with the RU analysis restricted to only include pairs of stations where AUSPOS reported that a baseline had been formed during processing. This allowed 1,455 pairs of stations to be analysed, producing median changes of -0.0031 m (HRU) and -0.0037 m (VRU) which are not significantly different to the full analysis shown in Figures 5b and 5d.
Conclusion
We conclude that AUSPOS positioning results do not significantly differ between single and cluster mode. Considering the additional effort required for field work planning and logistics, purpose-designed cluster networks offer little benefit, at least in regions covered by a dense CORS network such as NSW.
In some instances, AUSPOS users may encounter more frequent large-uncertainty warnings where cluster processing is employed, especially at sites with challenging sky view conditions. If such problems are encountered, the user is advised to try single mode AUSPOS processing.
However, AUSPOS clustering may be more convenient for some users and applications because concurrently observed RINEX files can be submitted together in one job and the processing results are received in a single AUSPOS report.
This is a decision of convenience rather than performance and will depend on the user’s preferences and the task at hand. In any case, AUSPOS continues to deliver high-quality positioning results via a sophisticated but convenient online service.
Nicholas Gowans and Dr Volker Janssen work at DCS Spatial Services, a unit of the NSW Department of Customer Service.


