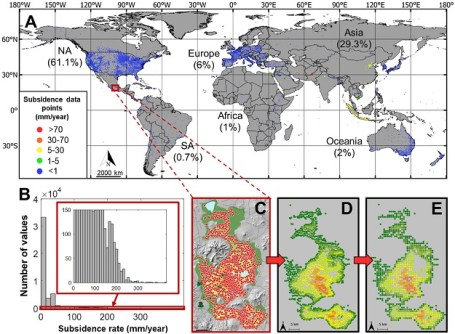
A team of scientists has produced what they claim to be first global map of land subsidence rates, using a data set of land subsidence which, they say, is likely the largest ever compiled.
The map has led the researchers to estimate that “more than 6.3 million square kilometres of the global land is influenced by significant subsidence rates”.
That includes 231,000 square kilometres of urban and dense settlement areas that are home to nearly 2 billion people.
Although subsidence can be caused by a number of natural and artificial factors such as seismic activity and mining, one of the main causes is groundwater extraction.
Indeed, the research, ‘Unveiling the Global Extent of Land Subsidence: The Sinking Crisis,’ published in Geophysical Research Letters, shows a strong positive correlation between the intensity of groundwater extraction and subsidence rates.
The authors say they used the large data set and 23 spatially continuous environmental parameters to train a machine learning model, which “learned to accurately predict subsidence at any location based on the provided predictors”.
“We applied the resulting model to produce the first global map of subsidence rate to date, which can be used to identify previously undocumented subsiding areas, motivate further local investigation, and provide crucial information for developing actionable policies to manage and mitigate subsidence effects in vulnerable regions.”
The authors found that “5% of the global area and 25% of the population are affected by significant land subsidence. These numbers are expected to rise, as changing climate, increasingly prolonged periods of drought, and growing population only exacerbate global dependency on groundwater.”
The researchers are hopeful that their work will “be used to increase awareness, help plan mitigation measures, and provide a foundation for optimized and regulated groundwater use policy. Additionally, the maps will be useful for such practical applications as urban planning and infrastructure development for cities that are located in subsiding areas.”
They go on to say that “knowledge of land subsidence rates will be instrumental for the insurance purposes as areas with high subsidence rates could be more susceptible to potential hazards,” and that “as subsidence can affect water drainage, leading to waterlogging or altered flow patterns, the map can be used by farmers and land managers to adapt their irrigation practices and crop choices.”