A bushfire risk index for Hobart and its environs has been released just in time for the upcoming summer season, which many people fear will be an unusually hot and dangerous one.
The Greater Hobart Bushfire Exposure Index is updated every year in order to give governments, emergency services providers and residents more information about the risk of fire and how to potentially mitigate against it.
The 2025 Index, which has been released by Geoneon in partnership the City of Hobart, City of Clarence, Kingborough Council and Derwent Valley Council, assesses exposure for approximately 112,000 buildings across Greater Hobart.
“Geoneon is focused on equipping councils and communities with decision‑ready bushfire exposure insights,” said Geoneon’s CEO, Roxane Bandini‑Maeder.
“This year’s update helps planners and residents prioritise mitigation and preparedness to build resilience. We’re excited to have partnered with the participating councils to deliver it for the third consecutive year.”
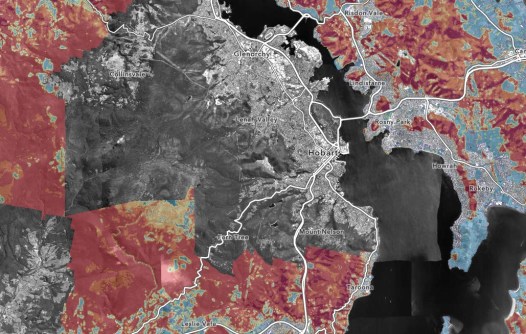
The Index combines satellite-derived vegetation mapping with terrain, climate and built-environment data to estimate the exposure of buildings if surrounding bushland were to burn.
Key points include:
- It estimates exposure by combining potential fire severity with the presence of buildings;
- It is a planning and preparedness tool, and therefore does not provide real-time warnings or predict where a fire will start or spread on a given day; and
- Results can be used to guide mitigation programs (e.g., fuel management, community preparedness) and inform strategic planning and infrastructure decisions.
According to Geoneon, the methodology involves:
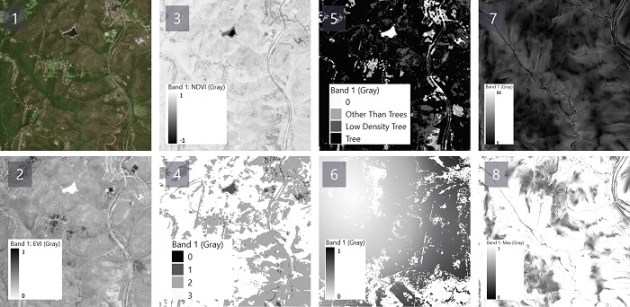
- Inputs of vegetation structure/classes, terrain/topography, long-term climate and weather factors, and built environment layers;
- Processing of satellite-derived vegetation mapping along with AI-assisted modelling to produce a relative exposure score;
- Suburb and street scale insights suitable for community engagement and mitigation planning; and
- An annual update cycle, with interim refinements applied where improvements are available.
The 2025 Index includes the Derwent Valley for the first time and features improved AI satellite imagery derived analytics.
In addition, enhancements to the AI‑derived vegetation layer improve the potential fire‑severity input and exposure scoring across the map.
“This Index gives us the evidence we need to make smarter planning decisions and support our community to prepare for bushfire risk,” said the Mayor Anna Reynolds, City of Hobart.
“It’s about using the best available science to protect what we value most — our homes, our environment and our people.”
“Clarence is blessed with many natural areas and bushland reserves, with many residents enjoying bushland right up to their backdoor,” added the Mayor Brendan Blomeley, City of Clarence.
“While this is an idyllic way to live, the threat of bushfire to these properties is very real. The Exposure Index will guide residents in understanding their level of risk and allow them to prepare accordingly, and in doing so, giving themselves the best chance to protect their property, possessions, and most importantly, their lives.”