For the geospatial community, new pollution exposure research provides a roadmap for environmental justice.
By Dr Qian (Chayn) Sun, RMIT University
If you look at the official air quality index for Melbourne on any given day, you might see a reassuring ‘good’ rating spanning the metropolitan area.
These macro-level readings are derived from a sparse network of highly accurate, state-run monitoring stations. But for urban planners and geospatial professionals, this regional brushstroke misses a crucial reality — air pollution is intensely hyper-local.
A recent study by researchers Jun Gao and Xuying Ma from Xi’an University of Science and Technology, and colleagues from RMIT University, published in the ISPRS International Journal of Geo-Information, pushes the boundaries of how we map airborne fine particulate matter PM2.5.
By moving beyond static sensor locations and adopting a high-resolution, population-weighted approach, the team has revealed the hidden micro-climates of pollution hiding in Melbourne’s street canyons and suburbs.
The geospatial mechanics of PM2.5
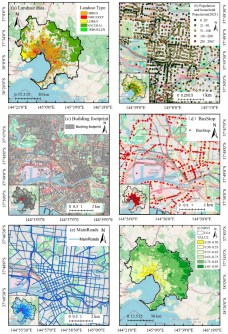
Traditional air quality maps often rely on simple interpolation between sensors. This study, however, utilised land use regression (LUR) modelling at a fine spatial scale. The model digests vast amounts of geospatial data — road networks, industrial zoning and vegetation — to find statistical relationships that predict pollution levels in areas where no sensors exist.

Crucially, the researchers implemented a ‘wind-sector based approach’. Acknowledging that pollution doesn’t radiate in perfect circles but drifts down prevailing wind corridors, the model incorporates seasonal wind directions to increase accuracy.
The ‘population-weighted’ paradigm
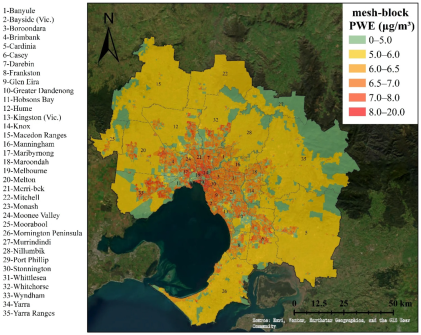
The core innovation of this research lies in the shift from geographic averages to population-weighted exposure (PWE).
Imagine an empty industrial park with high PM2.5 levels and a nearby residential tower with moderate levels. A simple geographic average (area-weighted) treats both areas equally.
However, from a public health perspective, the exposure of the people is what matters. By overlaying pollution rasters with high-resolution census population grids, the researchers calculated what Melbourne’s residents are actually breathing.
The results are a wake-up call for urban designers. In almost every season, the population-weighted exposure was higher than the area-weighted average, suggesting that Melbourne’s residents are disproportionately clustered near higher-pollution zones.
Measuring against global standards
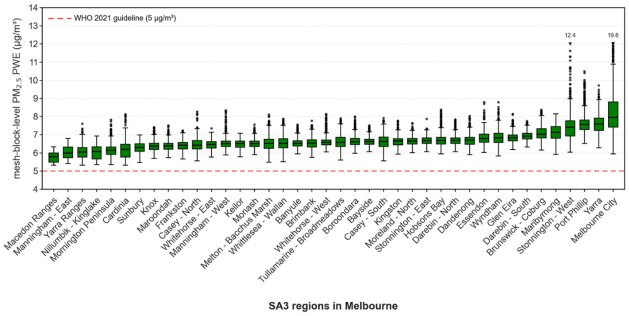
The study didn’t just map the pollution; it benchmarked Melbourne against international health standards. Using the 2021 World Health Organization Air Quality Guidelines — which set a stringent annual limit of 5 µg/m3 — the researchers analysed exposure across different Statistical Area Level 3 (SA3) units.
Seasonal shifts and strategic planning
Melbourne’s air quality is not static. The research highlighted significant seasonal variance, with winter seeing higher concentrations due to atmospheric stability and domestic wood heating.
For the geospatial community, this research provides a roadmap for ‘environmental justice’. By identifying areas where high population density overlaps with high pollution (even if those areas are far from an official sensor), planners can make data-driven decisions about where to locate schools, aged-care facilities and new green infrastructure.
A mandate for high-resolution data
As Melbourne continues to grow, the tools we use to monitor its liveability must become more sophisticated. This study demonstrates that high-resolution geospatial modelling is no longer just an academic exercise; it is an essential requirement for building healthy, sustainable cities.
By integrating population dynamics and wind patterns into our spatial models, we can move toward a future where ‘good’ air quality is a reality for every resident, not just a statistic for the city as a whole.
For technical details and the full dataset, refer to the study ‘Fine-Scale and Population-Weighted PM2.5 Modeling in Melbourne‘ published in the ISPRS International Journal of Geo-Information.
Dr Qian (Chayn) Sun is an Associate Professor (Geospatial Science) in the Department of Mathematical and Geospatial Sciences at RMIT University.